本文是对李伟豪先生的《高送转预测 逻辑回归与支持向量机》一个补充,主要讨论样本均衡对逻辑回归、决策树、SVM的影响。高送转的业务不是本文重点。
样本不平衡问题,顾名思义,即数据集中存在某一类样本,其数量远多于或远少于其他类样本,从而导致一些机器学习模型失效的问题。例如本文所讨论的高送转问题,因为绝大多数样本都为非高送转样本,高送转样本很少,算法会倾向于把大多数样本判定为正常样本,这样能达到很高的准确率,但是达不到很高的召回率。为了改善这个问题,本文使用了样本均衡方法,并实证了其对逻辑回归、决策树、SVM三类算法的影响。
1.数据准备
本文沿用李伟豪先生提供的数据(Div_data.csv)。
2.模型预测
2.1 训练集及测试集数据做成
通过train_test_split方法,生成样本均衡前的原始训练集及测试集。
2.2 样本均衡处理
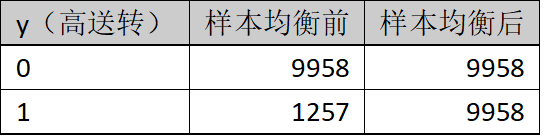
上采样(过采样)和下采样(负采样)策略是解决样本不平衡问题的基本方法之一。上采样即增加少数类样本的数量,下采样即减少多数类样本以获取相对平衡的数据集。本文采用上采样中的SMOTE算法。样本均衡处理前后的数据,参考表1所示。训练集及测试集在样本均衡处理前后的数据参考表2所示。
表1.样本均衡处理前后
表2.训练集及测试集样本均衡处理前后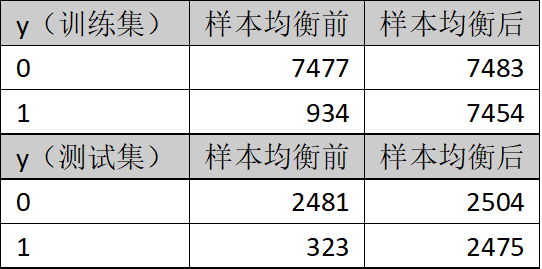
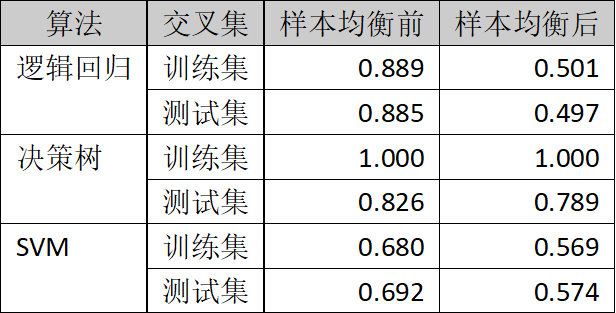
2.3 样本均衡前后的精度比较
样本均衡前后的精度比较参考表3所示。
表3.样本均衡前后的精度比较
由表3可知,在样本均衡处理后,各个算法的精度普遍下降。
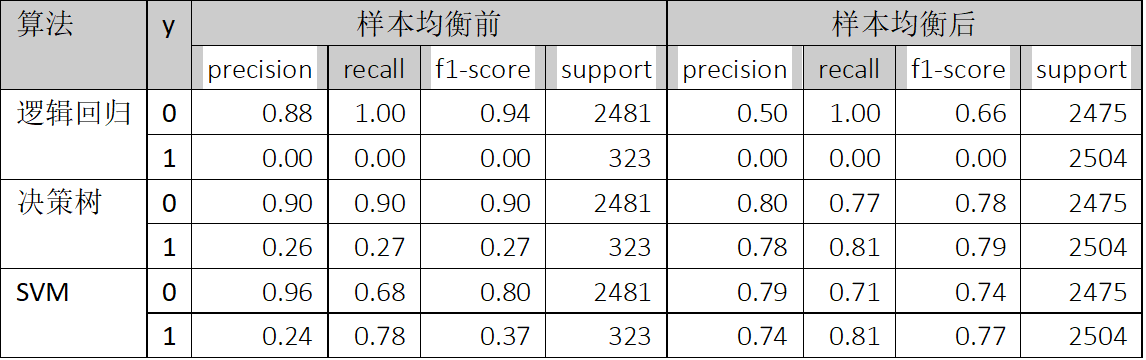
2.4 样本均衡前后的准确率、召回率、f1-score比较
样本均衡前后的准确率、召回率及f1-score的比较参考表4所示。
由表4可知,样本均衡前后,0(非高送转)的准确率、召回率及f1-score都有下降,而1(高送转)的准确率、召回率及f1-score都有显著上升。
2.5 样本均衡前后的准确率-召回率曲线比较
逻辑回归、决策树、SVM的准确率-召回率曲线可参考图1、2、3、4、5、6所示。
图1.逻辑回归准确率-召回率曲线(样本均衡前)
图2.逻辑回归准确率-召回率曲线(样本均衡后
图3.决策树准确率-召回率曲线(样本均衡前)
图4.决策树准确率-召回率曲线(样本均衡后)
图5.SVM准确率-召回率曲线(样本均衡前)
图6.SVM准确率-召回率曲线(样本均衡后)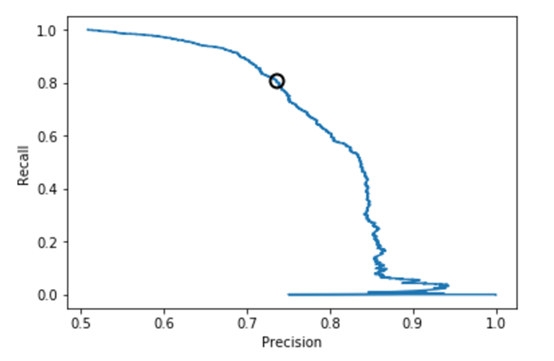

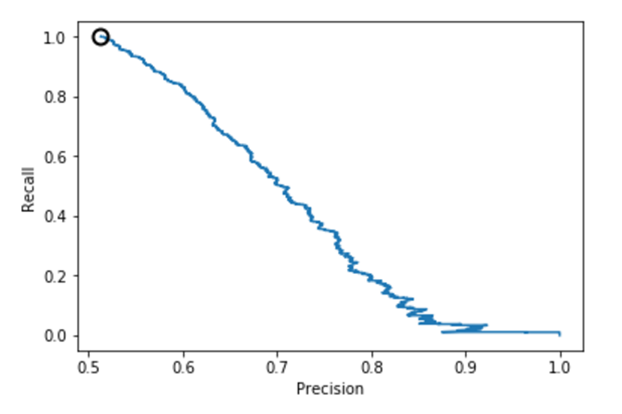
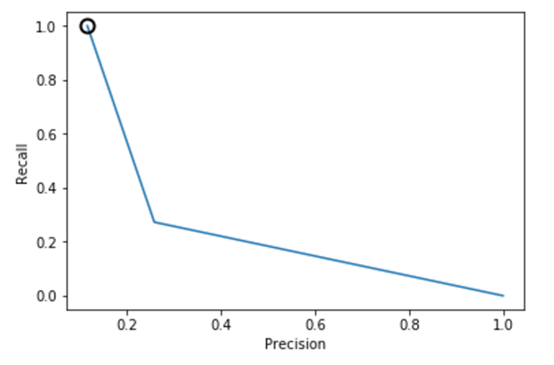
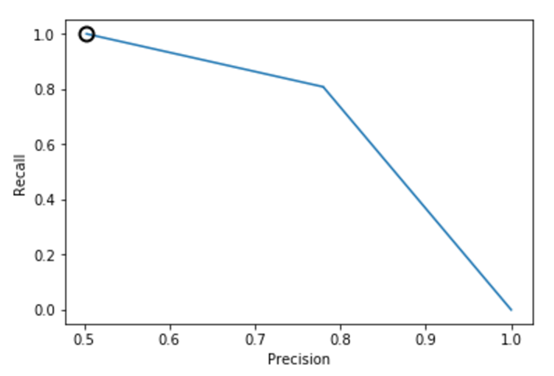
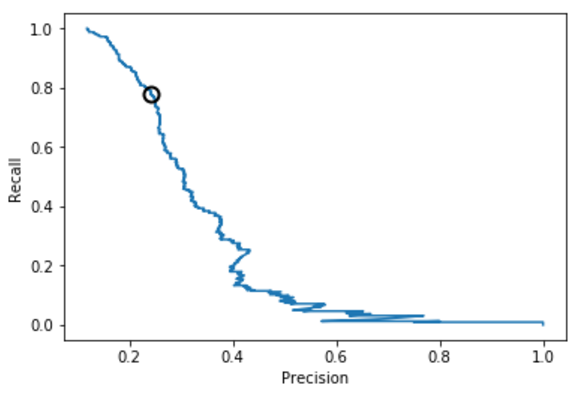
从上述图可知,样本均衡后,准确率-召回率曲线呈现向右上角弯曲的迹象,表明分类器得到了改善。
2.6 样本均衡前后的ROC曲线及AUC比较
逻辑回归、决策树、SVM的准确率-召回率曲线可参考图7、8、9、10、11、12所示。
图7.逻辑回归ROC曲线(样本均衡前)
图8.逻辑回归ROC曲线(样本均衡后)
图9.决策树ROC曲线(样本均衡前)
图10.决策树ROC曲线(样本均衡后)
图11.SVM ROC曲线(样本均衡前)
图12.SVM ROC曲线(样本均衡后)
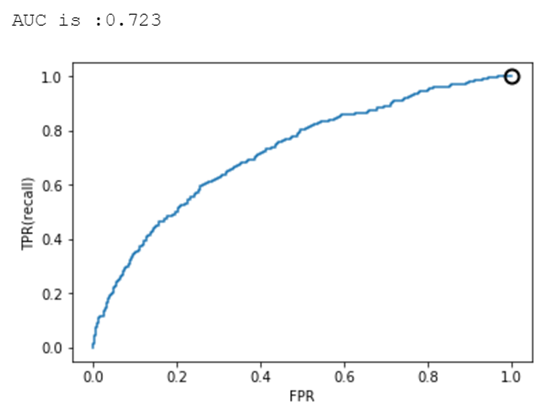


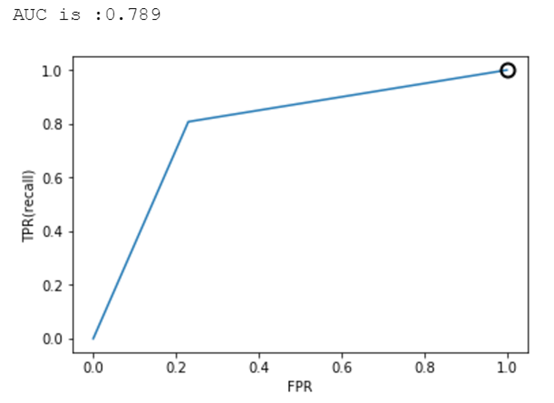
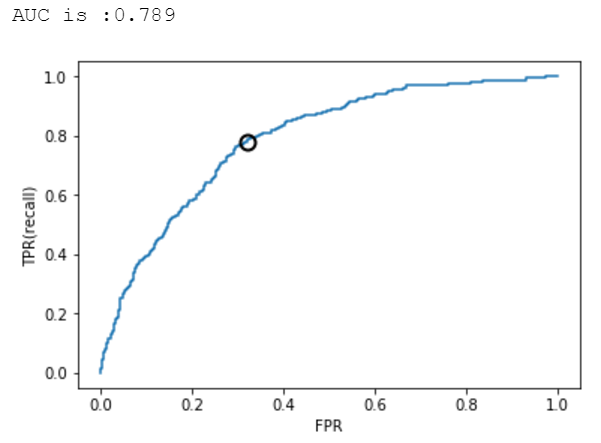
从上述图可知,样本均衡后,ROC曲线更靠近左上角,AUC值也更高了。
3. 结论
1.样本均衡处理会降低算法的精度。
2.样本均衡后是对于数量较多的那一类,譬如上述的0(非高送转)的准确率会降低,但可以提高数量较少的那一类,譬如上述的1(高送转)的准确率。对于实际业务来说,这是有意义,的因为我们更关心1(高送转)的准确率。
3.样本均衡处理总体上来说可以改进算法的预测能力,这一点从f1-score、准确率-召回率曲线、ROC曲线及AUC值可以看出。
以下是代码部分:
注:由于下述代码用到的一些不常见的库,譬如SMOTE(from imblearn.over_sampling import SMOTE),需要在JointQuant终端上*所需库后,方能顺利运行代码。
import pandas as pdimport numpy as npimport matplotlib.pyplot as pltimport datetimeimport matplotlib.pyplot as pltfrom sklearn.svm import SVCfrom sklearn.model_selection import StratifiedKFoldfrom sklearn.feature_selection import RFECVfrom sklearn import preprocessingfrom imblearn.over_sampling import SMOTE # 过抽样处理库SMOTEfrom collections import Counter
-ModuleNotFoundError Traceback (most recent call last)<ipython-input-1-9dd925d80b54> in <module> 9 from sklearn.feature_selection import RFECV 10 from sklearn import preprocessing-> 11 from imblearn.over_sampling import SMOTE # 过抽样处理库SMOTE 12 from collections import CounterModuleNotFoundError: No module named 'imblearn'
1.数据获取及预处理
1.1 分红数据获取
### 获取年末分红数据 ###div_data = pd.read_csv(r'Div_data.csv',index_col=0)##只留年报数据div_data['type'] = div_data['endDate'].map(lambda x:x[-5:])div_data['year'] = div_data['endDate'].map(lambda x:x[0:4])div_data_year = div_data[div_data['type'] == '12-31']div_data_year = div_data_year[['secID','year','publishDate', 'recordDate','perShareDivRatio', 'perShareTransRatio']]div_data_year.columns = ['stock','year','pub_date','execu_date','sg_ratio','zg_ratio']div_data_year.fillna(0,inplace = True)### 获取高送转数据 ####定义送转列:10送X+10转X合计div_data_year['sz_ratio'] = div_data_year['sg_ratio']+div_data_year['zg_ratio']# 定义是否高送转列(初始值为0)div_data_year['gsz'] = 0#高送转定义:10送X+10转X大于等于10,即定义为高送转div_data_year.loc[div_data_year['sz_ratio'] >=1,'gsz'] = 1#删除不需要列del div_data_year['sz_ratio'] del div_data_year['sg_ratio'] del div_data_year['zg_ratio']
div_data_year.describe()
.dataframe tbody tr th:only-of-type { vertical-align: middle; } .dataframe tbody tr th { vertical-align: top; } .dataframe thead th { text-align: right; }
| gsz | |
|---|---|
| count | 18045.000000 |
| mean | 0.098421 |
| std | 0.297891 |
| min | 0.000000 |
| 25% | 0.000000 |
| 50% | 0.000000 |
| 75% | 0.000000 |
| max | 1.000000 |
1.2 财务数据获取
###将一些指标转变为每股数值def get_perstock_indicator(need_indicator,old_name,new_name,sdate):target = get_fundamentals(query(valuation.code, valuation.capitalization, need_indicator),statDate = sdate)target[new_name] = target[old_name]/target['capitalization']/10000return target[['code',new_name]]
###获取每股收益、股本数量、营业收入同比增长、净利润同比增长def get_other_indicator(sdate):target = get_fundamentals(query(valuation.code, valuation.capitalization, indicator.inc_revenue_year_on_year, indicator.inc_net_profit_year_on_year, indicator.eps),statDate = sdate)# 营业收入同比增长target.rename(columns={'inc_revenue_year_on_year':'revenue_growth'},inplace = True)# 净利润同比增长target.rename(columns={'inc_net_profit_year_on_year':'profit_growth'},inplace = True) # 股本数量target['capitalization'] = target['capitalization']*10000return target[['code','capitalization','eps','revenue_growth','profit_growth']]###获取一个月收盘价平均值def get_bmonth_aprice(code_list,startdate,enddate):mid_data = get_price(code_list, start_date=startdate, end_date=enddate,\ frequency='daily', fields='close', skip_paused=False, fq='pre')mean_price = pd.DataFrame(mid_data['close'].mean(axis = 0),columns=['mean_price'])mean_price['code'] =mean_price.indexmean_price.reset_index(drop = True,inplace =True)return mean_price[['code','mean_price']]
###判断是否为次新股(判断标准为位于上市一年之内) def judge_cxstock(date):mid_data = get_all_securities(types=['stock'])mid_data['start_date'] = mid_data['start_date'].map(lambda x:x.strftime("%Y-%m-%d"))shift_date = str(int(date[0:4])-1)+date[4:]mid_data['1year_shift_date'] = shift_datemid_data['cx_stock'] = 0mid_data.loc[mid_data['1year_shift_date']<=mid_data['start_date'],'cx_stock'] = 1mid_data['code'] = mid_data.indexmid_data.reset_index(drop = True,inplace=True)return mid_data[['code','cx_stock']]###判断上市了多少个自然日from datetime import datedef get_dayslisted(year,month,day):mid_data = get_all_securities(types=['stock'])sdate = date(year,month,day)mid_data['days_listed'] = mid_data['start_date'].map(lambda x:(sdate -x).days)mid_data['code'] = mid_data.indexmid_data.reset_index(drop = True,inplace=True)return mid_data[['code','days_listed']]
"""输入:所需财务报表期、20日平均股价开始日期、20日平均股价结束日期输出:合并好的高送转数据 以及 财务指标数据"""def get_yearly_totaldata(statDate,statDate_before,mp_startdate,mp_enddate,year,month,day):##有能力高送转,基础指标包括:每股资本公积,每股留存收益##每股资本公积per_zbgj = get_perstock_indicator(balance.capital_reserve_fund,'capital_reserve_fund','per_CapitalReserveFund',statDate)#每股留存收益per_wflr = get_perstock_indicator(balance.retained_profit,'retained_profit','per_RetainProfit',statDate)##有能力高送转,其他指标包括:每股净资产、每股收益、营业收入同比增速、净利润同比增速##每股净资产per_jzc = get_perstock_indicator(balance.equities_parent_company_owners,'equities_parent_company_owners','per_TotalOwnerEquity',statDate) #每股收益、股本、营业收入同比增长、净利润同比增速other_indicator = get_other_indicator(statDate)code_list = other_indicator['code'].tolist()##有意愿高送转,指标包括均价、上市时间、股本增加#均价mean_price = get_bmonth_aprice(code_list,mp_startdate,mp_enddate)#是否为次新股cx_signal = judge_cxstock(mp_enddate)#股本增加#dz_signal = judge_dz(statDate,statDate_before)#上市时间days_listed = get_dayslisted(year,month,day)##因子列表:#每股资本公积#每股留存收益#每股净资产#每股收益、股本#均价#是否为次新股#上市时间chart_list = [per_zbgj,per_wflr,per_jzc,other_indicator,mean_price,cx_signal,days_listed]for chart in chart_list:chart.set_index('code',inplace = True)independ_vari = pd.concat([per_zbgj,per_wflr,per_jzc,other_indicator,mean_price,cx_signal,days_listed],axis = 1)independ_vari['year'] = str(int(statDate[0:4]))independ_vari['stock'] = independ_vari.indexindepend_vari.reset_index(drop=True,inplace =True)total_data = pd.merge(div_data_year,independ_vari,on = ['stock','year'],how = 'inner')# 每股资本公积 + 每股留存收益total_data['per_zbgj_wflr'] = total_data['per_CapitalReserveFund']+total_data['per_RetainProfit']return total_datagsz_2016 = get_yearly_totaldata('2016q3','2015q3','2016-10-01','2016-11-01',2016,11,1)gsz_2015 = get_yearly_totaldata('2015q3','2014q3','2015-10-01','2015-11-01',2015,11,1)gsz_2014 = get_yearly_totaldata('2014q3','2013q3','2014-10-01','2014-11-01',2014,11,1)gsz_2013 = get_yearly_totaldata('2013q3','2012q3','2013-10-01','2013-11-01',2013,11,1)gsz_2012 = get_yearly_totaldata('2012q3','2011q3','2012-10-01','2012-11-01',2012,11,1)gsz_2011 = get_yearly_totaldata('2011q3','2010q3','2011-10-01','2011-11-01',2011,11,1)/opt/conda/lib/python3.6/site-packages/jqresearch/api.py:108: FutureWarning: Panel is deprecated and will be removed in a future version. The recommended way to represent these types of 3-dimensional data are with a MultiIndex on a DataFrame, via the Panel.to_frame() method Alternatively, you can use the xarray package http://xarray.pydata.org/en/stable/. Pandas provides a `.to_xarray()` method to help automate this conversion. pre_factor_ref_date=_get_today()) /opt/conda/lib/python3.6/site-packages/ipykernel_launcher.py:46: FutureWarning: Sorting because non-concatenation axis is not aligned. A future version of pandas will change to not sort by default. To accept the future beh*ior, pass 'sort=False'. To retain the current beh*ior and silence the warning, pass 'sort=True'. /opt/conda/lib/python3.6/site-packages/jqresearch/api.py:108: FutureWarning: Panel is deprecated and will be removed in a future version. The recommended way to represent these types of 3-dimensional data are with a MultiIndex on a DataFrame, via the Panel.to_frame() method Alternatively, you can use the xarray package http://xarray.pydata.org/en/stable/. Pandas provides a `.to_xarray()` method to help automate this conversion. pre_factor_ref_date=_get_today()) /opt/conda/lib/python3.6/site-packages/ipykernel_launcher.py:46: FutureWarning: Sorting because non-concatenation axis is not aligned. A future version of pandas will change to not sort by default. To accept the future beh*ior, pass 'sort=False'. To retain the current beh*ior and silence the warning, pass 'sort=True'. /opt/conda/lib/python3.6/site-packages/jqresearch/api.py:108: FutureWarning: Panel is deprecated and will be removed in a future version. The recommended way to represent these types of 3-dimensional data are with a MultiIndex on a DataFrame, via the Panel.to_frame() method Alternatively, you can use the xarray package http://xarray.pydata.org/en/stable/. Pandas provides a `.to_xarray()` method to help automate this conversion. pre_factor_ref_date=_get_today()) /opt/conda/lib/python3.6/site-packages/ipykernel_launcher.py:46: FutureWarning: Sorting because non-concatenation axis is not aligned. A future version of pandas will change to not sort by default. To accept the future beh*ior, pass 'sort=False'. To retain the current beh*ior and silence the warning, pass 'sort=True'. /opt/conda/lib/python3.6/site-packages/jqresearch/api.py:108: FutureWarning: Panel is deprecated and will be removed in a future version. The recommended way to represent these types of 3-dimensional data are with a MultiIndex on a DataFrame, via the Panel.to_frame() method Alternatively, you can use the xarray package http://xarray.pydata.org/en/stable/. Pandas provides a `.to_xarray()` method to help automate this conversion. pre_factor_ref_date=_get_today()) /opt/conda/lib/python3.6/site-packages/ipykernel_launcher.py:46: FutureWarning: Sorting because non-concatenation axis is not aligned. A future version of pandas will change to not sort by default. To accept the future beh*ior, pass 'sort=False'. To retain the current beh*ior and silence the warning, pass 'sort=True'. /opt/conda/lib/python3.6/site-packages/jqresearch/api.py:108: FutureWarning: Panel is deprecated and will be removed in a future version. The recommended way to represent these types of 3-dimensional data are with a MultiIndex on a DataFrame, via the Panel.to_frame() method Alternatively, you can use the xarray package http://xarray.pydata.org/en/stable/. Pandas provides a `.to_xarray()` method to help automate this conversion. pre_factor_ref_date=_get_today()) /opt/conda/lib/python3.6/site-packages/ipykernel_launcher.py:46: FutureWarning: Sorting because non-concatenation axis is not aligned. A future version of pandas will change to not sort by default. To accept the future beh*ior, pass 'sort=False'. To retain the current beh*ior and silence the warning, pass 'sort=True'. /opt/conda/lib/python3.6/site-packages/jqresearch/api.py:108: FutureWarning: Panel is deprecated and will be removed in a future version. The recommended way to represent these types of 3-dimensional data are with a MultiIndex on a DataFrame, via the Panel.to_frame() method Alternatively, you can use the xarray package http://xarray.pydata.org/en/stable/. Pandas provides a `.to_xarray()` method to help automate this conversion. pre_factor_ref_date=_get_today()) /opt/conda/lib/python3.6/site-packages/ipykernel_launcher.py:46: FutureWarning: Sorting because non-concatenation axis is not aligned. A future version of pandas will change to not sort by default. To accept the future beh*ior, pass 'sort=False'. To retain the current beh*ior and silence the warning, pass 'sort=True'.
2.模型预测
2.1 训练集及验证集数据做成
from sklearn.model_selection import train_test_splitgszData = pd.concat([gsz_2011,gsz_2012,gsz_2013,gsz_2014,gsz_2015,gsz_2016],axis = 0)gszData.dropna(inplace = True)variable_list = ['per_zbgj_wflr','capitalization', 'eps', 'revenue_growth','profit_growth','mean_price', 'days_listed']X = gszData.loc[:,variable_list]y = gszData.loc[:,'gsz']
# 查看数据分布print(Counter(y))
Counter({0: 9958, 1: 1257})# 基于样本均衡前的数据进行训练集和测试集划分X_train,X_test,y_train,y_test = train_test_split(X,y,random_state=19)
# 查看数据分布print(Counter(y_train))
Counter({0: 7477, 1: 934})# 查看数据分布print(Counter(y_test))
Counter({0: 2481, 1: 323})3.2 样本均衡
# 样本均衡方法def sample_balance(X, y):''' 使用SMOTE方法对不均衡样本做过抽样处理 :param X: 输入特征变量X :param y: 目标变量y :return: 均衡后的X和y '''model_smote = SMOTE() # 建立SMOTE模型对象x_smote_resampled, y_smote_resampled = model_smote.fit_sample(X, y) # 输入数据并作过抽样处理return x_smote_resampled, y_smote_resampled
X_resampled,y_resampled = sample_balance(X, y)
# 查看数据分布print(Counter(y_resampled))
Counter({0: 9958, 1: 9958})# 基于样本均衡后的数据进行训练集和测试集划分X_train,X_test,y_train,y_test = train_test_split(X_resampled,y_resampled,random_state=19)
# 查看数据分布print(Counter(y_train))
Counter({0: 7483, 1: 7454})# 查看数据分布print(Counter(y_test))
Counter({1: 2504, 0: 2475})3.3 基于逻辑回归算法预测
from sklearn.linear_model import LogisticRegressionmodel = LogisticRegression(class_weight='balanced',C=1e9)model.fit(X_train, y_train)print("Trainning set score:{:.3f}".format(model.score(X_train,y_train)))print(" Test set score:{:.3f}".format(model.score(X_test,y_test)))Trainning set score:0.501 Test set score:0.497
D:\JoinQuant-Desktop-Py3\Python\lib\site-packages\sklearn\linear_model\logistic.py:433: FutureWarning: Default solver will be changed to 'lbfgs' in 0.22. Specify a solver to silence this warning.
  FutureWarning)
y_pred = model.predict(X_test)
y_pred_threshold = model.predict_proba(X_test)[:,1]
3.3 基于SVM算法预测
#均值方差标准化standard_scaler = preprocessing.StandardScaler()X_trainScale = standard_scaler.fit_transform(X_train)X_testScale = standard_scaler.transform(X_test) clf = SVC(C=1.0,class_weight='balanced',gamma='auto',kernel='rbf',probability=True)clf.fit(X_trainScale, y_train) print("Trainning set score:{:.3f}".format(clf.score(X_trainScale,y_train)))print(" Test set score:{:.3f}".format(clf.score(X_testScale,y_test)))D:\JoinQuant-Desktop-Py3\Python\lib\site-packages\sklearn\preprocessing\data.py:645: DataConversionWarning: Data with input dtype int64, float64 were all converted to float64 by StandardScaler. return self.partial_fit(X, y) D:\JoinQuant-Desktop-Py3\Python\lib\site-packages\sklearn\base.py:464: DataConversionWarning: Data with input dtype int64, float64 were all converted to float64 by StandardScaler. return self.fit(X, **fit_params).transform(X) D:\JoinQuant-Desktop-Py3\Python\lib\site-packages\ipykernel_launcher.py:4: DataConversionWarning: Data with input dtype int64, float64 were all converted to float64 by StandardScaler. after removing the cwd from sys.path.
Trainning set score:0.680
     Test set score:0.692
y_pred=clf.predict(X_testScale)
y_pred_threshold = clf.decision_function(X_testScale)
y_pred_changed_threshold = (y_pred_threshold > 0.3)
3.4 基于决策树算法预测
from sklearn.tree import DecisionTreeClassifiertree = DecisionTreeClassifier(random_state=0)tree.fit(X_train,y_train)print("Trainning set score:{:.3f}".format(tree.score(X_train,y_train)))print(" Test set score:{:.3f}".format(tree.score(X_test,y_test)))Trainning set score:1.000 Test set score:0.789
y_pred = tree.predict(X_test)
y_pred_threshold = tree.predict_proba(X_test)[:,1]
from sklearn.tree import export_graphvizimport graphvizdot_data = export_graphviz(tree,out_file=None,class_names=["GSZ ","NOT GSZ"],feature_names=X_train.columns, impurity=False,filled=True)graph = graphviz.Source(dot_data)
4.预测评价
4.1 混淆矩阵
from sklearn.metrics import confusion_matrixconfusion = confusion_matrix(y_test,y_pred)print("Confusion matrix:\n{}".format(confusion))Confusion matrix: [[70 2] [ 0 0]]
4.2 准确率、召回率及f1-score统计
from sklearn.metrics import classification_reportprint(classification_report(y_test,y_pred))
              precision    recall  f1-score   support

           0       0.96      0.68      0.80      2481
           1       0.24      0.78      0.37       323

   micro *g       0.69      0.69      0.69      2804
   macro *g       0.60      0.73      0.58      2804
weighted *g       0.88      0.69      0.75      2804
4.3 准确率-召回率曲线
from sklearn.metrics import precision_recall_curveprecision,recall,thresholds = precision_recall_curve(y_test,y_pred_threshold)plt.plot(precision,recall,label="precison recall curve")plt.xlabel("Precision")plt.ylabel("Recall")close_zero = np.argmin(np.abs(thresholds))plt.plot(precision[close_zero],recall[close_zero],'o',markersize=10,label="threshold zero",fillstyle="none",c='k',mew=2)[<matplotlib.lines.Line2D at 0x19e*782fd0>]
4.4 ROC曲线和AUC
from sklearn.metrics import roc_auc_scorefrom sklearn.metrics import roc_curvefpr,tpr,thresholds = roc_curve(y_test,y_pred_threshold)plt.plot(fpr,tpr,label="ROC Curve")plt.xlabel("FPR")plt.ylabel("TPR(recall)")close_zero = np.argmin(np.abs(thresholds))plt.plot(fpr[close_zero],tpr[close_zero],'o',markersize=10,label="threshold zero",fillstyle="none",c='k',mew=2)auc = roc_auc_score(y_test,y_pred_threshold)print("AUC is :{:.3f}".format(auc))AUC is :0.789
5.2017年预测
###取出2017年数据statDate = '2017q3'mp_startdate = '2017-10-01' mp_enddate = '2017-11-01'year = 2017month = 11 day = 1per_zbgj = get_perstock_indicator(balance.capital_reserve_fund,'capital_reserve_fund','per_CapitalReserveFund',statDate)per_wflr = get_perstock_indicator(balance.retained_profit,'retained_profit','per_RetainedProfit',statDate)per_jzc = get_perstock_indicator(balance.total_owner_equities,'total_owner_equities','per_TotalOwnerEquity',statDate)other_indicator = get_other_indicator(statDate)code_list = other_indicator['code'].tolist()mean_price = get_bmonth_aprice(code_list,mp_startdate,mp_enddate)cx_signal = judge_cxstock(mp_enddate)days_listed = get_dayslisted(year,month,day)chart_list = [per_zbgj,per_wflr,per_jzc,other_indicator,mean_price,cx_signal,days_listed]for chart in chart_list:chart.set_index('code',inplace = True)independ_vari = pd.concat([per_zbgj,per_wflr,per_jzc,other_indicator,mean_price,cx_signal,days_listed],axis = 1)independ_vari['year'] = str(int(statDate[0:4]))independ_vari['stock'] = independ_vari.indexindepend_vari.reset_index(drop=True,inplace =True)independ_vari['per_zbgj_wflr'] = independ_vari['per_CapitalReserveFund']+independ_vari['per_RetainedProfit']gsz_2017 = independ_varigsz_2017.loc[gsz_2017['revenue_growth']>300,'revenue_growth'] = 300testdata = gsz_2017testdata.dropna(inplace = True)###利用决策树做预测X_2017 = testdata[variable_list]y_2017 = tree.predict(X_2017)y_2017_proba = tree.predict_proba(X_2017)D:\JoinQuant-Desktop-Py3\Python\lib\site-packages\ipykernel_launcher.py:7: SADeprecationWarning: Compiled objects now compile within the constructor. import sys D:\JoinQuant-Desktop-Py3\Python\lib\site-packages\ipykernel_launcher.py:7: SADeprecationWarning: Compiled objects now compile within the constructor. import sys D:\JoinQuant-Desktop-Py3\Python\lib\site-packages\ipykernel_launcher.py:7: SADeprecationWarning: Compiled objects now compile within the constructor. import sys D:\JoinQuant-Desktop-Py3\Python\lib\site-packages\ipykernel_launcher.py:9: SADeprecationWarning: Compiled objects now compile within the constructor. if __name__ == '__main__': D:\JoinQuant-Desktop-Py3\Python\lib\site-packages\ipykernel_launcher.py:14: FutureWarning: Panel is deprecated and will be removed in a future version. The recommended way to represent these types of 3-dimensional data are with a MultiIndex on a DataFrame, via the Panel.to_frame() method Alternatively, you can use the xarray package http://xarray.pydata.org/en/stable/. Pandas provides a `.to_xarray()` method to help automate this conversion. D:\JoinQuant-Desktop-Py3\Python\lib\site-packages\ipykernel_launcher.py:22: FutureWarning: Sorting because non-concatenation axis is not aligned. A future version of pandas will change to not sort by default. To accept the future beh*ior, pass 'sort=False'. To retain the current beh*ior and silence the warning, pass 'sort=True'.
total_tree = testdata[['stock']].copy()total_tree['predict_prob'] = y_2017_proba[:,1]
#选取前50(最有可能性)股票total_tree.sort_values(by='predict_prob',inplace = True,ascending = False)total_tree.reset_index(drop=True,inplace = True)total_tree[:50]
.dataframe tbody tr th:only-of-type { vertical-align: middle; } .dataframe tbody tr th { vertical-align: top; } .dataframe thead th { text-align: right; }
| stock | predict_prob | |
|---|---|---|
| 0 | 600039.XSHG | 1.0 |
| 1 | 002073.XSHE | 1.0 |
| 2 | 002061.XSHE | 1.0 |
| 3 | 002798.XSHE | 1.0 |
| 4 | 300230.XSHE | 1.0 |
| 5 | 300229.XSHE | 1.0 |
| 6 | 600382.XSHG | 1.0 |
| 7 | 002067.XSHE | 1.0 |
| 8 | 002068.XSHE | 1.0 |
| 9 | 300227.XSHE | 1.0 |
| 10 | 002802.XSHE | 1.0 |
| 11 | 002805.XSHE | 1.0 |
| 12 | 600121.XSHG | 1.0 |
| 13 | 601360.XSHG | 1.0 |
| 14 | 601339.XSHG | 1.0 |
| 15 | 002080.XSHE | 1.0 |
| 16 | 002081.XSHE | 1.0 |
| 17 | 600120.XSHG | 1.0 |
| 18 | 601318.XSHG | 1.0 |
| 19 | 601313.XSHG | 1.0 |
| 20 | 601311.XSHG | 1.0 |
| 21 | 300218.XSHE | 1.0 |
| 22 | 600622.XSHG | 1.0 |
| 23 | 600107.XSHG | 1.0 |
| 24 | 002057.XSHE | 1.0 |
| 25 | 002537.XSHE | 1.0 |
| 26 | 600609.XSHG | 1.0 |
| 27 | 600392.XSHG | 1.0 |
| 28 | 002787.XSHE | 1.0 |
| 29 | 002788.XSHE | 1.0 |
| 30 | 002037.XSHE | 1.0 |
| 31 | 300247.XSHE | 1.0 |
| 32 | 002039.XSHE | 1.0 |
| 33 | 002040.XSHE | 1.0 |
| 34 | 002544.XSHE | 1.0 |
| 35 | 002042.XSHE | 1.0 |
| 36 | 300245.XSHE | 1.0 |
| 37 | 300244.XSHE | 1.0 |
| 38 | 601607.XSHG | 1.0 |
| 39 | 002790.XSHE | 1.0 |
| 40 | 002048.XSHE | 1.0 |
| 41 | 300241.XSHE | 1.0 |
| 42 | 002796.XSHE | 1.0 |
| 43 | 002054.XSHE | 1.0 |
| 44 | 601566.XSHG | 1.0 |
| 45 | 002088.XSHE | 1.0 |
| 46 | 002809.XSHE | 1.0 |
| 47 | 002029.XSHE | 1.0 |
| 48 | 600651.XSHG | 1.0 |
| 49 | 300193.XSHE | 1.0 |