本人在阅读RSRS研报的时候,发现作者人为选择了右偏态的数据样本,以尽量达到最优解,本人觉得这样操作有过拟合的嫌疑,遂在聚宽论坛提出该质疑,现在随意测试了一个样本,提供大家参考
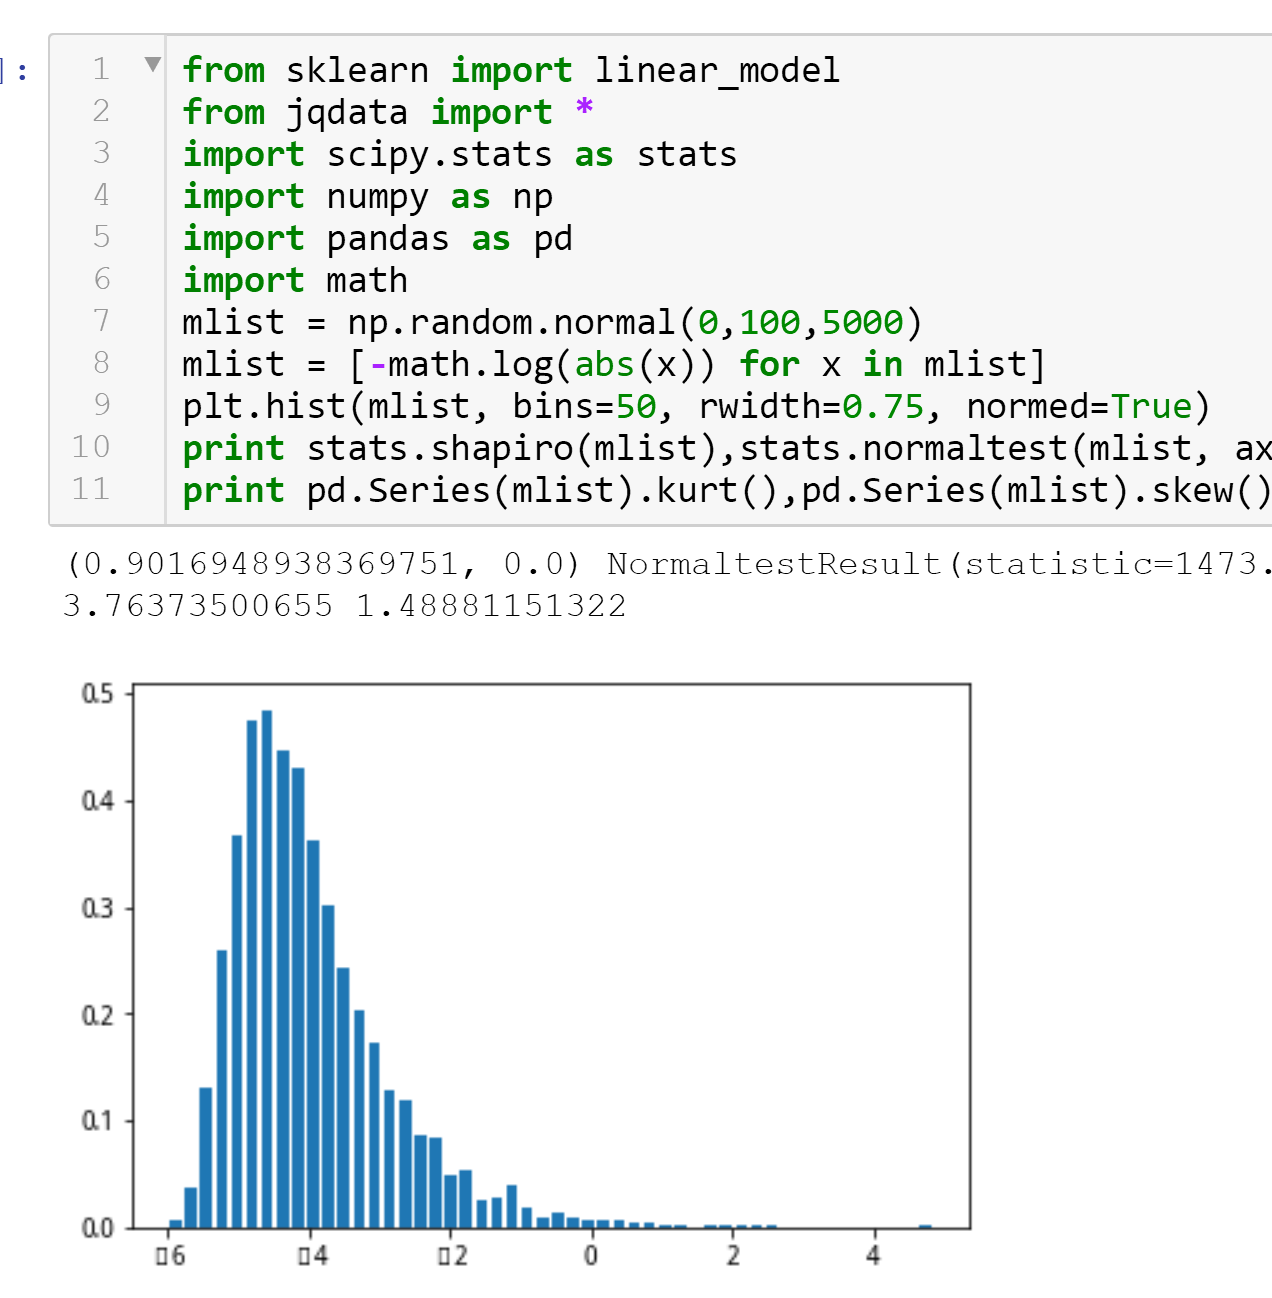
以上偏态数据,是我以随机数跑的比较好的偏态,以-lg进行偏态,而研究中拿HS300样本的涨幅值作为样本,修分加以-lg和乘以涨幅值的平方根作为样本,目的是为了找到skew大于2的样本分布。
可以看到,-lg和乘以涨幅值没有任何指标意义,但是仅仅为了达到右偏态的分布,该数据样本作为参考取[5,80]的置信区间样本数量就填的RSRS没有做优化,也具有一定的逃顶抄底的能力
而这个偏态样本比RSRS差的就是其kurt峰度偏高,导致样本分布不均匀,集中度太高。
抱歉,我没有太多时间对样本进行修峰和改偏,也没有太多时间调参找个完美的样本值出来。
只想证明一点,RSRS右偏态以后一定是有人为过拟合在里面的,但是,无可否认,RightSkewedDist的普遍认知就是对于金融收益有显著帮助。
Positively Skewed Distribution in Finance
In finance, the concept of skewness is utilized in the analysis of the distribution of the returns of investments. Although many finance theories and models assume that the returns from securities follow the normal distribution, in reality, the returns are usually skewed.
The positive skewness of a distribution indicates that an investor may expect frequent small losses and few large gains from the investment. The positively skewed distributions of investment returns are generally more desirable by investors since there is some probability to gain huge profits that can cover all the frequent small losses.
from sklearn import linear_modelfrom jqdata import *import scipy.stats as statsimport numpy as npimport pandas as pdimport mathmlist = np.random.normal(0,100,5000)mlist = [-math.log(abs(x)) for x in mlist]plt.hist(mlist, bins=50, rwidth=0.75, normed=True)print stats.shapiro(mlist),stats.normaltest(mlist, axis=None)print pd.Series(mlist).kurt(),pd.Series(mlist).skew()
(0.9016948938369751, 0.0) NormaltestResult(statistic=1473.5390636592667, pvalue=0.0)
3.76373500655 1.48881151322
class RSRS_CALC:N = 18M = 1100def __init__(self,security,date,N,M) :self.date = dateself.security = securityself.N = Nself.M = Mdef get_prices(self,start_date,count) :security = self.securityend_date = self.dateif count > 0 : prices = attribute_history(security, count, '1d', ['close'])elif start_date is not None: prices = get_price(security = security, start_date = start_date, end_date = end_date, \ frequency='daily', fields=['close'])if len(prices.values)>0 :return prices.closeelse: passdef calc_OLS_list(self,x) : #OLS线性回归results = x.pct_change().dropna()return results[-1:].valuesdef create_base_record(self,start_date = '2005-01-05'):N = self.Ncloses = self.get_prices(start_date,0)beta_list = []for i in range(N,len(closes)):x = closes[i-N:i]results = self.calc_OLS_list(x)if len(results)>0:beta_list.append(results[0])return beta_listdef new_beta_record(self):N = self.Ncloses = self.get_prices(None,N)x = closesresults = self.calc_OLS_list(x)beta= results[0]return betadef calc_rscore(self,beta_list):# 计算标准化的RSRS指标M = self.Mif not (len(beta_list) > 0 or len(rightdev_list) > 0 ):beta_list = self.create_base_record('2005-01-05')beta = self.new_beta_record()beta_list.append(beta)section = beta_list[-M:] # 计算均值序列 zscore = stats.zscore(section).tolist()[-1] #序列标准分#计算右偏RSRS标准分#zscore_rightdev= zscore*betazscore_rightdev= -1*math.log(abs(zscore))*sqrt(abs(beta))return zscore_rightdevdef marshal(self,beta_list):DF = pd.DataFrame([beta_list],index=['beta']).TDF['zscore'] = DF.beta.apply(lambda x: (x-DF.beta.mean())/DF.beta.std())DF['rscore'] = DF.zscore.apply(lambda x: -math.log(abs(x)))DF['qscore'] = DF.apply(lambda x: -1*x.rscore*sqrt(abs(x.beta)),axis=1)return DF,np.nanpercentile(DF.qscore,82),np.nanpercentile(DF.qscore,18)security = '000300.XSHG'N = 18date = datetime.datetime.now() - datetime.timedelta(days=1)rs = RSRS_CALC(security,date,18,1100)#print rs.create_base_record(start_date = '2005-01-05')beta_list = rs.create_base_record('2005-01-05')#print beta_list#print rs.new_beta_record()print rs.calc_rscore(beta_list)0.0772102943992
DF,buy,sell = rs.marshal(beta_list)print buy,sell
0.0228792076364 -0.0957525415834
list = DF.qscoreplt.hist(list, bins=50, rwidth=0.5, normed=True)print ('mean=%s'%list.mean(),'median=%s'%list.median(),'std=%s'%list.std())print ('kurt=%s'%pd.Series(list).kurt(),'skew=%s'%pd.Series(list).skew())('mean=-0.0336967998088', 'median=-0.063744547322', 'std=0.0877070494485')
('kurt=6.37847721174', 'skew=2.19969895672')
本社区仅针对特定人员开放
查看需注册登录并通过风险意识测评
5秒后跳转登录页面...
移动端课程