我们都知道,外汇交易者使用货币对报价进行交易。所谓货币对,就是把一个国家的货币值以另一个国家的货币来表示。很容易就能在多个货币对中找到相同的货币。因为货币的价值是由它所在国家的经济状况决定的,我们可能会问,当国家经济有变化的时候,它的货币在不同的货币对中的影响是否是一致的,看起来答案肯定是这样的,但这只是当只有一个国家的经济状态有变时的完美特例,现实生活中我们的世界是不断变化的,一个国家的经济变化会直接或者间接地影响到全球的经济。
在互连网上,您可以找到很多信息是关于分析货币价格在不同货币对中的改变以及寻找不同货币对之间的相互关联的。在本站中,您可以找到关于交易货币对篮子的文章 [1, 2, 3]。尽管如此,分析时间序列之间相互关联的问题依然存在,在本文中,我提出了开发一种图形化分析时间序列之间相互关联的工具,它可以可视化所分析的货币对报价的时间序列之间的相互关联。
在我们开始工作之前,让我们定义我们的目标。我们最后想要得到哪种工具?首先,它应当是一个图形面板,包含着传入的时间序列之间相互关联的图形。这个工具应当是足够多功能的,可以用于处理不同数量的时间序列。
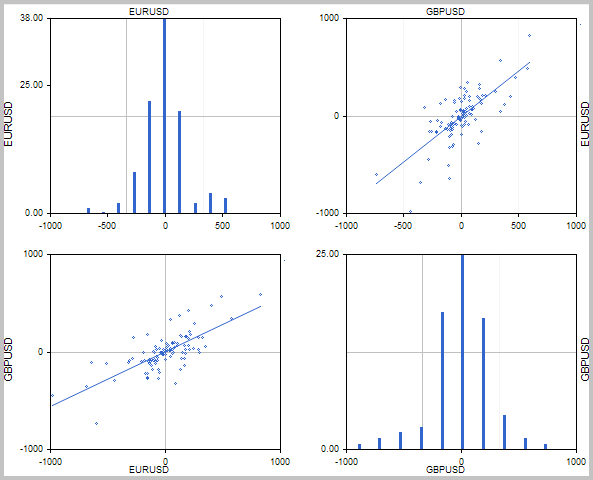
为了在面板上分析时间序列,我们将为每个时间序列构建一个分布柱形图,我们还将准备成对显示的散点图,用来分析时间序列以寻找相互关联。在散点图上会加上趋势线,作为可视化的参考。
图形的布局将是一个交叉表的形式,这样可以提高整个工具的可读性。这种方法统一了数据的表现形式,并且从视觉方面来看更加简单。所述工具的布局如下所示。

当开发这样的工具时,我们应当记住,用户可能会操作不同数量的交易资产。我相信,最佳的可视化方案是基于区块的表示方法,其中使用标准的图形来作为构建一个统一相互关联表格的“砖石”。
我们将会从准备图表构建基础开始,来开发我们的工具。MetaTrader 5 基础发布部分含有 CGraphic 类,可以用于构建科学图表,这篇文章 [4] 提供了这个类的详细描述,我们将会以它为基础来构建我们的图形图表。让我们创建 CPlotBase 基类,并且使它继承于 CGraphic 标准类,在这个类中,我们将创建用于生成图形画布的方法。将会有两个这样的方法: 第一个用于使用给定的边宽来画方形区域,而第二个用于使用给定的坐标来画长方形区域。我们还将加上用于在图形的侧边显示文字的方法 (它们将会帮助我们显示资产的名称)。另外,让我们加上用于在时间序列图上改变显示颜色的方法。
我们应该记住,我们所使用的 CGraphic 基类不是派生于 CObject 类的,并且没有包含在图形中重新分配、隐藏和显示对象的方法,类似的方法在图形面板上有广泛使用,所以,我们需要在创建的类中加上这些方法,这样我们的工具就和构建图形面板的标准类兼容了。
class CPlotBase : public CGraphic
  {
protected:
   long              m_chart_id;                // 图表 ID
   int               m_subwin;                  // 图表子窗口

public:
                     CPlotBase();
                    ~CPlotBase();
//--- 创建对象
   virtual bool      Create(const long chart,const string name,const int subwin,const int x1,const int y1,const int size);
   virtual bool      Create(const long chart,const string name,const int subwin,const int x1,const int y1,const int x2,const int y2);
//--- 改变时间序列标签的颜色
   virtual bool      SetTimeseriesColor(uint clr, uint timeserie=0);
//--- 在图表上加上文字
   virtual void      TextUp(string text, uint clr);
   virtual void      TextDown(string text, uint clr);
   virtual void      TextLeft(string text, uint clr);
   virtual void      TextRight(string text, uint clr);
//--- 几何
   virtual bool      Shift(const int dx,const int dy);
//--- 状态
   virtual bool      Show(void);
   virtual bool      Hide(void);
  };
在类的构造函数中,删除图形的纵向显示并且设置在轴上的最少标签数量。
CPlotBase::CPlotBase()
  {
   HistoryNameWidth(0);
   HistorySymbolSize(0);
   m_x.MaxLabels(3);
   m_y.MaxLabels(3);
  }
在附件中可以找到所有类方法的完整代码。
下一步,开发用于显示散点图的 CScatter 类。这个类将只包含两个方法,用于创建和更新时间序列的数据。
class CScatter : public CPlotBase { public: CScatter(); ~CScatter(); //--- int AddTimeseries(const double ×eries_1[],const double ×eries_2[]); bool UpdateTimeseries(const double ×eries_1[],const double ×eries_2[],uint timeserie=0); };
向 AddTimeseries 曲线创建方法传入的是散点图所依赖的两个分析资产的时间序列,CGraphic 标准类可以根据两个数据数组显示一个点形图。我们将会使用这个功能。在方法的开始,根据两个数据数组创建一个点曲线,如果曲线创建失败,就返回 "-1" 的结果退出函数。如果成功创建了曲线,设置曲线点的大小并设置趋势线显示的标志。在进行所有操作之后,方法会返回所创建曲线的索引。
int CScatter::AddTimeseries(const double ×eries_1[],const double ×eries_2[]) { CCurve *curve=CGraphic::CurveAdd(timeseries_1,timeseries_2,CURVE_POINTS); if(curve==NULL) return -1; curve.PointsSize(2); curve.TrendLineVisible(true); return (m_arr_curves.Total()-1); }
为了更新曲线数据,我们创建了 UpdateTimeseries 方法,传给它的参数是两个用于创建曲线的数据数组和需要更新数据曲线的索引。在函数的开始,检查指定的曲线编号是否有效,如果编号是错误指定的,就退出函数,返回 'false'。
然后,比较所得到时间序列的维度,如果数组的大小不同或者数组是空的,退出函数并返回 'false'。
下一步是指定根据索引的曲线对象的指针,如果指针不正确,就退出函数返回 'false'。
在全部检查之后,把时间序列传给曲线并退出函数返回 'true'。
bool CScatter::UpdateTimeseries(const double ×eries_1[],const double ×eries_2[], uint timeserie=0) { if((int)timeserie>=m_arr_curves.Total()) return false; if(ArraySize(timeseries_1)!=ArraySize(timeseries_2) || ArraySize(timeseries_1)==0) return false; //--- CCurve *curve=m_arr_curves.At(timeserie); if(CheckPointer(curve)==POINTER_INVALID) return false; //--- curve.Update(timeseries_1,timeseries_2); //--- return true; }
柱形图是另一个用于构建我们工具的“砖块”,我们需要 CHistogram 类来创建它。与 CScatter 类似, 这个类也要有它自己的曲线数据生成和更新方法,但是,和前者不同,这个类使用一个时间序列来构建曲线。构造这些方法的原则和前一个类的方法类似,
请记住,CGraphic 基类只能以它的标准形式构建柱形图。为了增加构建与市场概况类似的垂直柱形图的功能,我们将必须重写 HistogramPlot 方法。另外,我们应当加上 e_orientation 变量,用于保存柱形图构建的类型,并且重写图形画布创建方法,加上可以指定柱形图类型的功能。
我们的类和 CGpraphic 基类的另一个区别是我们取得的初始数据的类型,在基类中,会把取得的数值数组直接输出到图形中。我们的类得到的是时间序列,在处理柱形图之间,会需要处理获得的数据,准备用于构建柱形图的数据是在 CalculateHistogramArray 方法中进行的, 柱形图列的数量是由 SetCells 方法设置的,并且会被保存在 i_cells 变量中。
class CHistogram : public CPlotBase { private: ENUM_HISTOGRAM_ORIENTATION e_orientation; uint i_cells; public: CHistogram(); ~CHistogram(); //--- bool Create(const long chart,const string name,const int subwin,const int x1,const int y1,const int size, ENUM_HISTOGRAM_ORIENTATION orientation=HISTOGRAM_HORIZONTAL); bool Create(const long chart,const string name,const int subwin,const int x1,const int y1,const int x2,const int y2, ENUM_HISTOGRAM_ORIENTATION orientation=HISTOGRAM_HORIZONTAL); int AddTimeserie(const double ×erie[]); bool UpdateTimeserie(const double ×erie[],uint timeserie=0); bool SetCells(uint value) { i_cells=value; } protected: virtual void HistogramPlot(CCurve *curve); bool CalculateHistogramArray(const double &data[],double &intervals[],double &frequency[], double &maxv,double &minv); };
CalculateHistogramArray 方法是基于 MQL5 参考中的算法,又增加了一些小的功能。在方法的开始,检查初始数据是否足够来绘制柱形图,确定最小值和最大值,计算每个间隙的范围宽度,并准备数组用于保存间隔和频率。
随后,会在循环中设置间隔并把频率数组清空为零。
在下一个循环中,迭代时间序列并对符合对应间隔的数值进行计数。
最后,规范化频率,把符合条件计数转换为在时间序列中元素总数的百分比。
bool CHistogram::CalculateHistogramArray(const double &data[],double &intervals[],double &frequency[],
                             double &maxv,double &minv)
  {
   int size=ArraySize(data);
   if(size<(int)i_cells*10) return (false);
   minv=data[ArrayMinimum(data)];
   maxv=data[ArrayMaximum(data)];
   double range=maxv-minv;
   double width=range/i_cells;
   if(width==0) return false;
   ArrayResize(intervals,i_cells);
   ArrayResize(frequency,i_cells);
//--- 设置间隔中心
   for(uint i=0; i<i_cells; i++)
     {
      intervals[i]=minv+(i+0.5)*width;
      frequency[i]=0;
     }
//--- 填充间隔和频率
   for(int i=0; i<size; i++)
     {
      uint ind=int((data[i]-minv)/width);
      if(ind>=i_cells) ind=i_cells-1;
      frequency[ind]++;
     }
//--- 把频率规范化为百分比
   for(uint i=0; i<i_cells; i++)
      frequency[i]*=(100.0/(double)size);
   return (true);
  }
柱形图是使用 HistogramPlot 方法画在图形中的,这个函数是根据 CGraphic 基类的算法构建的,为了使用时间序列以及柱形图的生成方向进行了修改。
在方法的开始,准备用于绘制柱形图的数据,为此,我们从曲线数据中取得时间序列并调用 CalculateHistogramArray 方法。在这个函数成功执行之后,我们就得到了柱形图的宽度,并可以检查构成数据的数组大小。
下一步,根据柱形图的显示类型格式化轴上的数值。
最后,在图形区域中循环显示图表列。
CHistogram::HistogramPlot(CCurve *curve)
  {
   double data[],intervals[],frequency[];
   double max_value, min_value;
   curve.GetY(data);
   if(!CalculateHistogramArray(data,intervals,frequency,max_value,min_value))
      return;
//--- 柱形图参数
   int histogram_width=fmax(curve.HistogramWidth(),2);
//--- 检查
   if(ArraySize(frequency)==0 || ArraySize(intervals)==0)
      return;
//---
   switch(e_orientation)
     {
      case HISTOGRAM_HORIZONTAL:
        m_y.AutoScale(false);
        m_x.Min(intervals[ArrayMinimum(intervals)]);
        m_x.Max(intervals[ArrayMaximum(intervals)]);
        m_x.MaxLabels(3);
        m_x.ValuesFormat("%.0f");
        m_y.Min(0);
        m_y.Max(frequency[ArrayMaximum(frequency)]);
        m_y.ValuesFormat("%.2f");
        break;
      case HISTOGRAM_VERTICAL:
        m_x.AutoScale(false);
        m_y.Min(intervals[ArrayMinimum(intervals)]);
        m_y.Max(intervals[ArrayMaximum(intervals)]);
        m_y.MaxLabels(3);
        m_y.ValuesFormat("%.0f");
        m_x.Min(0);
        m_x.Max(frequency[ArrayMaximum(frequency)]);
        m_x.ValuesFormat("%.2f");
        break;
     }
//---
   CalculateXAxis();
   CalculateYAxis();
//--- 计算 y 的起点
   int originalY=m_height-m_down;
   int originalX=m_width-m_right;
   int yc0=ScaleY(0.0);
   int xc0=ScaleX(0.0);
//--- 取得曲线颜色
   uint clr=curve.Color();
//--- 画图
   for(uint i=0; i<i_cells; i++)
     {
      //--- 检查坐标
      if(!MathIsValidNumber(frequency[i]) || !MathIsValidNumber(intervals[i]))
         continue;
      if(e_orientation==HISTOGRAM_HORIZONTAL)
        {
         int xc=ScaleX(intervals[i]);
         int yc=ScaleY(frequency[i]);
         int xc1 = xc - histogram_width/2;
         int xc2 = xc + histogram_width/2;
         int yc1 = yc;
         int yc2 = (originalY>yc0 && yc0>0) ? yc0 : originalY;
         //---
         if(yc1>yc2)
            yc2++;
         else
            yc2--;
         //---
         m_canvas.FillRectangle(xc1,yc1,xc2,yc2,clr);
        }
      else
        {
         int yc=ScaleY(intervals[i]);
         int xc=ScaleX(frequency[i]);
         int yc1 = yc - histogram_width/2;
         int yc2 = yc + histogram_width/2;
         int xc1 = xc;
         int xc2 = (originalX>xc0 && xc0>0) ? xc0 : originalX;
         //---
         if(xc1>xc2)
            xc2++;
         else
            xc2--;
         //---
         m_canvas.FillRectangle(xc1,yc1,xc2,yc2,clr);
        }
     }
//---
  }
所有类和方法的完整代码在附件中。
为了构建工具,我们还需要另一个“砖块”来下载所需的历史数据以及准备时间序列用于画图,这项工作将是在 CTimeserie 类中进行的。在初始化类的时候,会传给它资产名称、时段和使用的价格类型。另外,还需要创建改变资产名称、时段、使用的价格类型以及历史深度的方法。
class CTimeserie : public CObject { protected: string s_symbol; ENUM_TIMEFRAMES e_timeframe; ENUM_APPLIED_PRICE e_price; double d_timeserie[]; int i_bars; datetime dt_last_load; public: CTimeserie(void); ~CTimeserie(void); bool Create(const string symbol=NULL, const ENUM_TIMEFRAMES timeframe=PERIOD_CURRENT, const ENUM_APPLIED_PRICE price=PRICE_CLOSE); //--- 改变时间序列的设置 void SetBars(const int value) { i_bars=value; } void Symbol(string value) { s_symbol=value; dt_last_load=0; } void Timeframe(ENUM_TIMEFRAMES value) { e_timeframe=value; dt_last_load=0; } void Price(ENUM_APPLIED_PRICE value) { e_price=value; dt_last_load=0; } //--- string Symbol(void) { return s_symbol; } ENUM_TIMEFRAMES Timeframe(void) { return e_timeframe; } ENUM_APPLIED_PRICE Price(void) { return e_price; } //--- 载入数据 virtual bool UpdateTimeserie(void); bool GetTimeserie(double ×erie[]) { return ArrayCopy(timeserie,d_timeserie)>0; } };
主要的数据准备工作是在 UpdateTimeserie 方法中完成的。在这个方法的开始,检查当前的柱上是否已经载入了所需的信息,如果信息已经载入完毕,就退出函数返回 'true'。如果需要准备数据,根据指定的价格上传所需的历史数据,如果无法上传信息,就退出函数返回 'false'。请注意,我们对价格本身并没有兴趣,关注的是它的变化。所以上传的历史数据要比指定的数量多一个柱。在下一步,我们在循环中在每个柱上重新计算价格的变化并把它保存到数组中。以后,用户就可以通过使用 GetTimeserie 方法来取得这些信息了。
bool CTimeserie::UpdateTimeserie(void)
  {
   datetime cur_date=(datetime)SeriesInfoInteger(s_symbol,e_timeframe,SERIES_LASTBAR_DATE);
   if(dt_last_load>=cur_date && ArraySize(d_timeserie)>=i_bars)
      return true;
//---
   MqlRates rates[];
   int bars=0,i;
   double data[];
   switch(e_price)
     {
      case PRICE_CLOSE:
        bars=CopyClose(s_symbol,e_timeframe,1,i_bars+1,data);
        break;
      case PRICE_OPEN:
        bars=CopyOpen(s_symbol,e_timeframe,1,i_bars+1,data);
      case PRICE_HIGH:
        bars=CopyHigh(s_symbol,e_timeframe,1,i_bars+1,data);
      case PRICE_LOW:
        bars=CopyLow(s_symbol,e_timeframe,1,i_bars+1,data);
      case PRICE_MEDIAN:
        bars=CopyRates(s_symbol,e_timeframe,1,i_bars+1,rates);
        bars=ArrayResize(data,bars);
        for(i=0;i<bars;i++)
           data[i]=(rates[i].high+rates[i].low)/2;
        break;
      case PRICE_TYPICAL:
        bars=CopyRates(s_symbol,e_timeframe,1,i_bars+1,rates);
        bars=ArrayResize(data,bars);
        for(i=0;i<bars;i++)
           data[i]=(rates[i].high+rates[i].low+rates[i].close)/3;
        break;
      case PRICE_WEIGHTED:
        bars=CopyRates(s_symbol,e_timeframe,1,i_bars+1,rates);
        bars=ArrayResize(data,bars);
        for(i=0;i<bars;i++)
           data[i]=(rates[i].high+rates[i].low+2*rates[i].close)/4;
        break;
     }
//---
   if(bars<=0)
      return false;
//---
   dt_last_load=cur_date;
//---
   if(ArraySize(d_timeserie)!=(bars-1) && ArrayResize(d_timeserie,bars-1)<=0)
      return false;
   double point=SymbolInfoDouble(s_symbol,SYMBOL_POINT);
   for(i=0;i<bars-1;i++)
      d_timeserie[i]=(data[i+1]-data[i])/point;
//---
   return true;
  }
所有类和它们方法的完整代码都在附件中。
在创建了 "砖块" 之后, 我们就可以开始开发我们的工具了。让我们创建 CPairPlot 类,它派生于 CWndClient 类。这种方法将可以使在使用标准的 CAppDialog 类所创建的图形面板中使用我们的工具更加容易 (这种应用程序的详细情况可以在下列文章中找到 [5,6]).
在我们类的 'private' 部分,声明 CPlotBase 类对象的指针数组用于保存图形的指针,CArrayObj 类对象用于保存时间序列对象的指针,以及用于保存所使用的时段、价格、柱形图方向、历史深度和在图形中显示资产名称颜色的变量。
class CPairPlot : public CWndClient
  {
private:
   CPlotBase                    *m_arr_graphics[];
   CArrayObj                     m_arr_symbols;
   ENUM_TIMEFRAMES               e_timeframe;
   ENUM_APPLIED_PRICE            e_price;
   int                           i_total_symbols;
   uint                          i_bars;
   ENUM_HISTOGRAM_ORIENTATION    e_orientation;
   uint                          i_text_color;

public:
                     CPairPlot();
                    ~CPairPlot();
//---
   bool              Create(const long chart,const string name,const int subwin,const int x1,const int y1,const int x2,const int y2, const string &symbols[],const ENUM_TIMEFRAMES timeframe=PERIOD_CURRENT, const int bars=1000, const uint cells=10, const ENUM_APPLIED_PRICE price=PRICE_CLOSE);
   bool              Refresh(void);
   bool              HistogramOrientation(ENUM_HISTOGRAM_ORIENTATION value);
   ENUM_HISTOGRAM_ORIENTATION    HistogramOrientation(void)    {  return e_orientation;   }
   bool              SetTextColor(color value);
//--- 几何
   virtual bool      Shift(const int dx,const int dy);
//--- 状态
   virtual bool      Show(void);
   virtual bool      Hide(void);
  };
类方法声明在 'public' 部分,类的初始化是在 Create 方法中进行的,需要传入的参数有图形 ID, 对象名称, 应用的子窗口索引, 创建的坐标, 使用的交易品种数组, 使用的时段, 价格, 历史深度和柱形图的列数。
在方法的开始,检查传入的资产名称数组和指定的历史深度,如果它们不能达到我们的最低要求,就退出函数返回 'false'。然后保存输入参数的值用于画图。
bool CPairPlot::Create(const long chart,const string name,const int subwin,const int x1,const int y1,const int x2,const int y2, const string &symbols[],const ENUM_TIMEFRAMES timeframe=PERIOD_CURRENT, const int bars=1000, const uint cells=10, const ENUM_APPLIED_PRICE price=PRICE_CLOSE)
  {
   i_total_symbols=0;
   int total=ArraySize(symbols);
   if(total<=1 || bars<100)
      return false;
//---
   e_timeframe=timeframe;
   i_bars=bars;
   e_price=price;
下一步,在循环中为每个资产创建 CTimeserie 类的实例。如果不能为每个指定的资产创建时间序列,就退出函数并返回 'false'。
   for(int i=0;i<total;i++)
     {
      CTimeserie *temp=new CTimeserie;
      if(temp==NULL)
         return false;
      temp.SetBars(i_bars);
      if(!temp.Create(symbols[i],e_timeframe,e_price))
         return false;
      if(!m_arr_symbols.Add(temp))
         return false;
     }
   i_total_symbols=m_arr_symbols.Total();
   if(i_total_symbols<=1)
      return false;
在成功完成了准备工作之后,就继续直接创建图形对象。首先,调用父类的 Create 方法,然后,使 m_arr_graphics 数组(用于保存图形指针)的大小设为与分析的资产数量相等。根据全部资产和所分析资产的数量大小来计算每个图的宽度和高度,
随后,使用两个嵌套的循环来在所有要分析的资产上迭代,使用图形对象创建表格。在有相同名称的资产交叉时创建柱形图,在其它情况下创建散点图。如果所有的对象都成功创建,就退出函数返回 'true'。
   if(!CWndClient::Create(chart,name,subwin,x1,y1,x2,y2))
      return false;
//---
   if(ArraySize(m_arr_graphics)!=(i_total_symbols*i_total_symbols))
      if(ArrayResize(m_arr_graphics,i_total_symbols*i_total_symbols)<=0)
         return false;
   int width=Width()/i_total_symbols;
   int height=Height()/i_total_symbols;
   for(int i=0;i<i_total_symbols;i++)
     {
      CTimeserie *timeserie1=m_arr_symbols.At(i);
      if(timeserie1==NULL)
         continue;
      for(int j=0;j<i_total_symbols;j++)
        {
         string obj_name=m_name+"_"+(string)i+"_"+(string)j;
         int obj_x1=m_rect.left+j*width;
         int obj_x2=obj_x1+width;
         int obj_y1=m_rect.top+i*height;
         int obj_y2=obj_y1+height;
         if(i==j)
           {
            CHistogram *temp=new CHistogram();
            if(CheckPointer(temp)==POINTER_INVALID)
               return false;
            if(!temp.Create(m_chart_id,obj_name,m_subwin,obj_x1,obj_y1,obj_x2,obj_y2,e_orientation))
               return false;
            m_arr_graphics[i*i_total_symbols+j]=temp;
            temp.SetCells(cells);
           }
         else
           {
            CScatter *temp=new CScatter();
            if(CheckPointer(temp)==POINTER_INVALID)
               return false;
            if(!temp.Create(m_chart_id,obj_name,m_subwin,obj_x1,obj_y1,obj_x2,obj_y2))
               return false;
            CTimeserie *timeserie2=m_arr_symbols.At(j);
            if(timeserie2==NULL)
               continue;
            m_arr_graphics[i*i_total_symbols+j]=temp;
           }
        }
     }
//---
   return true;
  }
Refresh 方法是用于更新时间序列数据和在图形中显示数据的。在方法的开始,会在循环中更新所有时间序列的数据。请注意,当您构建一个分布图时,时间序列是成对使用的,所以,数据应当可以比较。为了确保数据的兼容性,图形对象的数据不会更新,而只要在更新至少一个时间序列出现错误的时候,方法就会返回 'false'。
在更新了时间序列数据之后,会再进行循环把更新过的时间序列传给图形对象。注意,要使用 'false' 参数来调用图形对象的 Update 方法。这样的调用可以确保图形对象更新的时候不必更新应用程序正运行在上方的图形,这种方法会在更新每个图形对象时排除掉之前更新过的,这样可以减少终端的负载并减少函数的执行时间。图形在更新了所有的图形元素后、在退出函数之前再更新一次。
bool CPairPlot::Refresh(void)
  {
   bool updated=true;
   for(int i=0;i<i_total_symbols;i++)
     {
      CTimeserie *timeserie=m_arr_symbols.At(i);
      if(timeserie==NULL)
         continue;
      updated=(updated && timeserie.UpdateTimeserie());
     }
   if(!updated)
      return false;
//---
   for(int i=0;i<i_total_symbols;i++)
     {
      CTimeserie *timeserie1=m_arr_symbols.At(i);
      if(CheckPointer(timeserie1)==POINTER_INVALID)
         continue;
      double ts1[];
      if(!timeserie1.GetTimeserie(ts1))
         continue;
//---
      for(int j=0;j<i_total_symbols;j++)
        {
         if(i==j)
           {
            CHistogram *temp=m_arr_graphics[i*i_total_symbols+j];
            if(CheckPointer(temp)==POINTER_INVALID)
               return false;
            if(temp.CurvesTotal()==0)
              {
               if(temp.AddTimeserie(ts1)<0)
                  continue;
              }
            else
              {
               if(!temp.UpdateTimeserie(ts1))
                  continue;
              }
            if(!temp.CurvePlotAll())
               continue;
            if(i==0)
               temp.TextUp(timeserie1.Symbol(),i_text_color);
            if(i==(i_total_symbols-1))
               temp.TextDown(timeserie1.Symbol(),i_text_color);
            if(j==0)
               temp.TextLeft(timeserie1.Symbol(),i_text_color);
            if(j==(i_total_symbols-1))
               temp.TextRight(timeserie1.Symbol(),i_text_color);
            temp.Update(false);
           }
         else
           {
            CScatter *temp=m_arr_graphics[i*i_total_symbols+j];
            if(CheckPointer(temp)==POINTER_INVALID)
               return false;
            CTimeserie *timeserie2=m_arr_symbols.At(j);
            if(CheckPointer(timeserie2)==POINTER_INVALID)
               continue;
            double ts2[];
            if(!timeserie2.GetTimeserie(ts2))
               continue;
            if(temp.CurvesTotal()==0)
              {
               if(temp.AddTimeseries(ts1,ts2)<0)
                  continue;
              }
            else
               if(!temp.UpdateTimeseries(ts1,ts2))
                  continue;
            if(!temp.CurvePlotAll())
               continue;
            if(i==0)
               temp.TextUp(timeserie2.Symbol(),i_text_color);
            if(i==(i_total_symbols-1))
               temp.TextDown(timeserie2.Symbol(),i_text_color);
            if(j==0)
               temp.TextLeft(timeserie1.Symbol(),i_text_color);
            if(j==(i_total_symbols-1))
               temp.TextRight(timeserie1.Symbol(),i_text_color);
            temp.Update(false);
           }
        }
     }
//---
   ChartRedraw(m_chart_id);
//---
   return true;
  }
之前,我已经提到过,图形元素是基于 CGraphic 类而不是派生于 CObject 类,因为这个原因,我们在 CPlotBase 基类中加入了 Shift, Hide 和 Show 方法,因为同样的原因,我们也必须在 CPairPlot 类中重写对应的方法。所有类和它们方法的完整代码都在附件中。
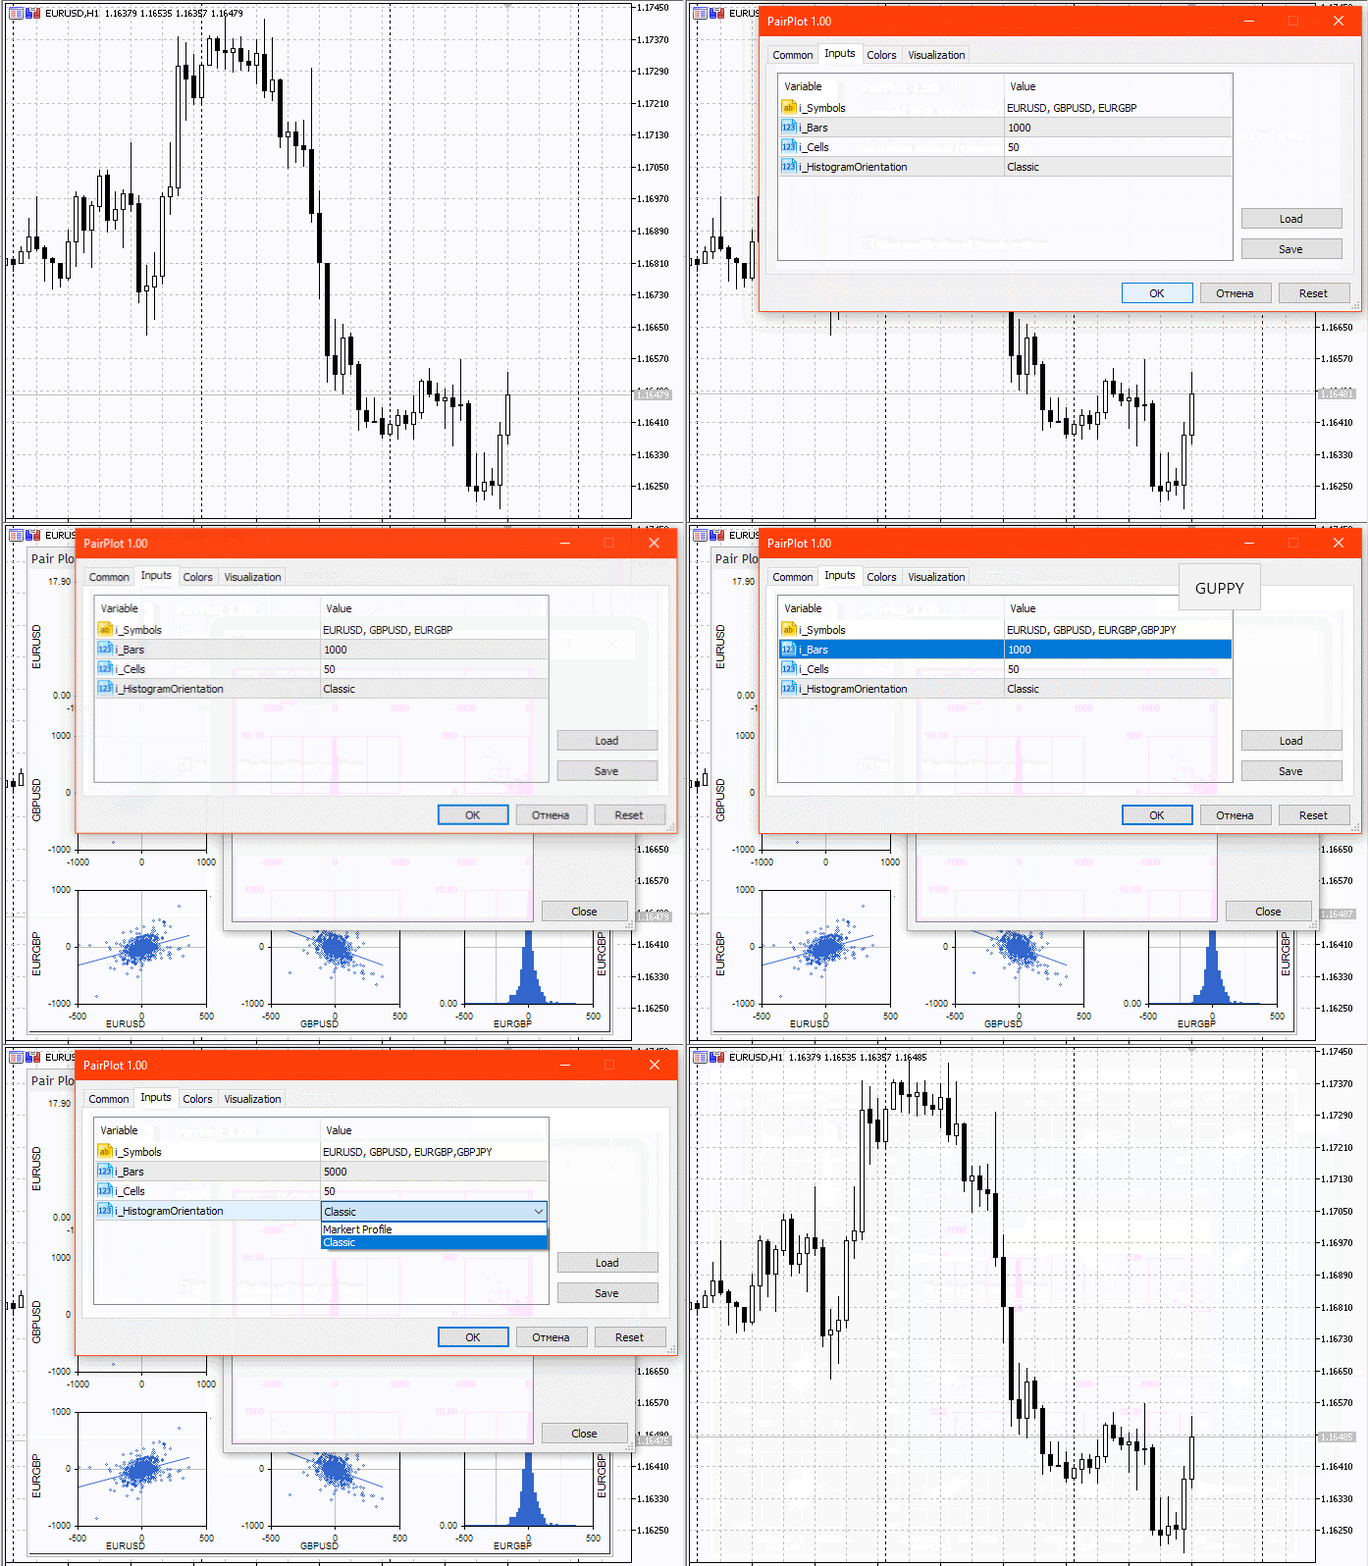
现在,在做了这么多工作之后,是时候看看结果了。为了运行演示工具,让我们制作一个指标来显示相互关联图形,例如对于最新的1000个烛形,在每个新柱时显示。
上面已经提到,这个工具是为了图形面板创建的,所以,让我们首先创建派生于 CAppDialog 类的 CPairPlotDemo 类。操作 CAppDialog 类的详细情况可以在文章 [5, 6] 中找到。在此,我将只会指出使用这个工具所特有的地方。
在 'private' 部分声明 CPairPlot 类的实例,在 'public' 部分,声明 Create 方法,其中含有所有工具初始化和运行时所需的输入参数。在此,我们还要声明 Refresh 和 HistogramOrientation 方法,它们会调用我们工具中的对应方法。
class CPairPlotDemo : public CAppDialog
  {
private:
   CPairPlot         m_PairPlot;
public:
                     CPairPlotDemo();
                    ~CPairPlotDemo();
//---
   bool              Create(const long chart,const string name,const int subwin,const int x1,const int y1,const int x2,const int y2,const string &symbols[],const ENUM_TIMEFRAMES timeframe=PERIOD_CURRENT, const int bars=1000, const uint cells=10);
   bool              Refresh(void);
//---
   bool              HistogramOrientation(ENUM_HISTOGRAM_ORIENTATION value)   {  return m_PairPlot.HistogramOrientation(value);   }
   ENUM_HISTOGRAM_ORIENTATION    HistogramOrientation(void)                   {  return m_PairPlot.HistogramOrientation();   }
   };
在 Create 方法中,首先调用父类中的相应方法,然后调用元件实例的相同方法并把指针加到 CPairPlot 的类实例中的控件元件集合。
bool CPairPlotDemo::Create(const long chart,const string name,const int subwin,const int x1,const int y1,const int x2,const int y2,const string &symbols[],const ENUM_TIMEFRAMES timeframe=PERIOD_CURRENT, const int bars=1000, const uint cells=10)
  {
   if(!CAppDialog::Create(chart,name,subwin,x1,y1,x2,y2))
      return false;
   if(!m_PairPlot.Create(m_chart_id,m_name+"PairPlot",m_subwin,0,0,ClientAreaWidth(),ClientAreaHeight(),symbols,timeframe,bars,cells))
      return false;
   if(!Add(m_PairPlot))
      return false;
//---
   return true;
  }
现在,让我们创建指标。我们指标中使用的参数有,使用逗号分隔的资产名称字符串, 分析历史深度的柱数,柱形图的列数和指向。
input string   i_Symbols   =  "EURUSD, GBPUSD, EURGBP";
input uint     i_Bars      =  1000;
input uint     i_Cells     =  50;
input ENUM_HISTOGRAM_ORIENTATION i_HistogramOrientation  =  HISTOGRAM_HORIZONTAL;
在全局变量中声明 CPairPlotDemo 类的实例。
CPairPlotDemo *PairPlot;
在 OnInit 函数中,根据指标外部参数中的字符串创建使用资产的数组,然后创建一个 CPairPlotDemo 类的实例,传给它指定的柱形图指向然后再调用它的 Create 方法。在成功初始化之后,使用 Run 方法载入类并运行,并使用 Refresh 方法更新数据。
int OnInit()
  {
//---
   string symbols[];
   int total=StringSplit(i_Symbols,',',symbols);
   if(total<=0)
      return INIT_FAILED;
   for(int i=0;i<total;i++)
     {
      StringTrimLeft(symbols[i]);
      StringTrimRight(symbols[i]);
     }
//---
   PairPlot=new CPairPlotDemo;
   if(CheckPointer(PairPlot)==POINTER_INVALID)
      return INIT_FAILED;
//---
   if(!PairPlot.HistogramOrientation(i_HistogramOrientation))
      return INIT_FAILED;
   if(!PairPlot.Create(0,"Pair Plot",0,20,20,620,520,symbols,PERIOD_CURRENT,i_Bars,i_Cells))
      return INIT_FAILED;
   if(!PairPlot.Run())
      return INIT_FAILED;
   PairPlot.Refresh();
//---
   return INIT_SUCCEEDED;
  }
在 OnCalculate 函数中,在每个新柱处调用 Refresh 方法。在 OnChartEvent 和 OnDenint 函数中将会调用相应的类方法。
在附件中有所有函数和类的完整代码。
下面您将可以看到指标是如何工作的。

在本文中,我们提供了一个很有趣的工具,它允许交易者快速而简单地看到几乎任意数量的交易资产之间的相互关联。这个工具的主要目的是分析交易资产而开发各种套利策略。当然,这个工具本身还不足以开发一个完整功能的交易系统,但是它可以在开发交易系统的第一阶段大量使用 - 寻找相关的资产和它们的依赖关系。
| # |
名称 |
类型 |
描述 |
|---|---|---|---|
| 1 | PlotBase.mqh | 类库 | Base class for building graphs |
| 2 | Scatter.mqh | 类库 | 用于创建散点图的类 |
| 3 | Histogram.mqh | 类库 | 用于创建柱形图的类 |
| 4 | PairPlot.mqh | 类库 | PairPlot 工具类 |
| 5 | PairPlotDemo.mqh | 类库 | 用于演示工具连接的类 |
| 6 | PairPlot.mq5 | 指标 | 用于演示工具工作的指标 |

本社区仅针对特定人员开放
查看需注册登录并通过风险意识测评
5秒后跳转登录页面...
移动端课程
