静态效果图: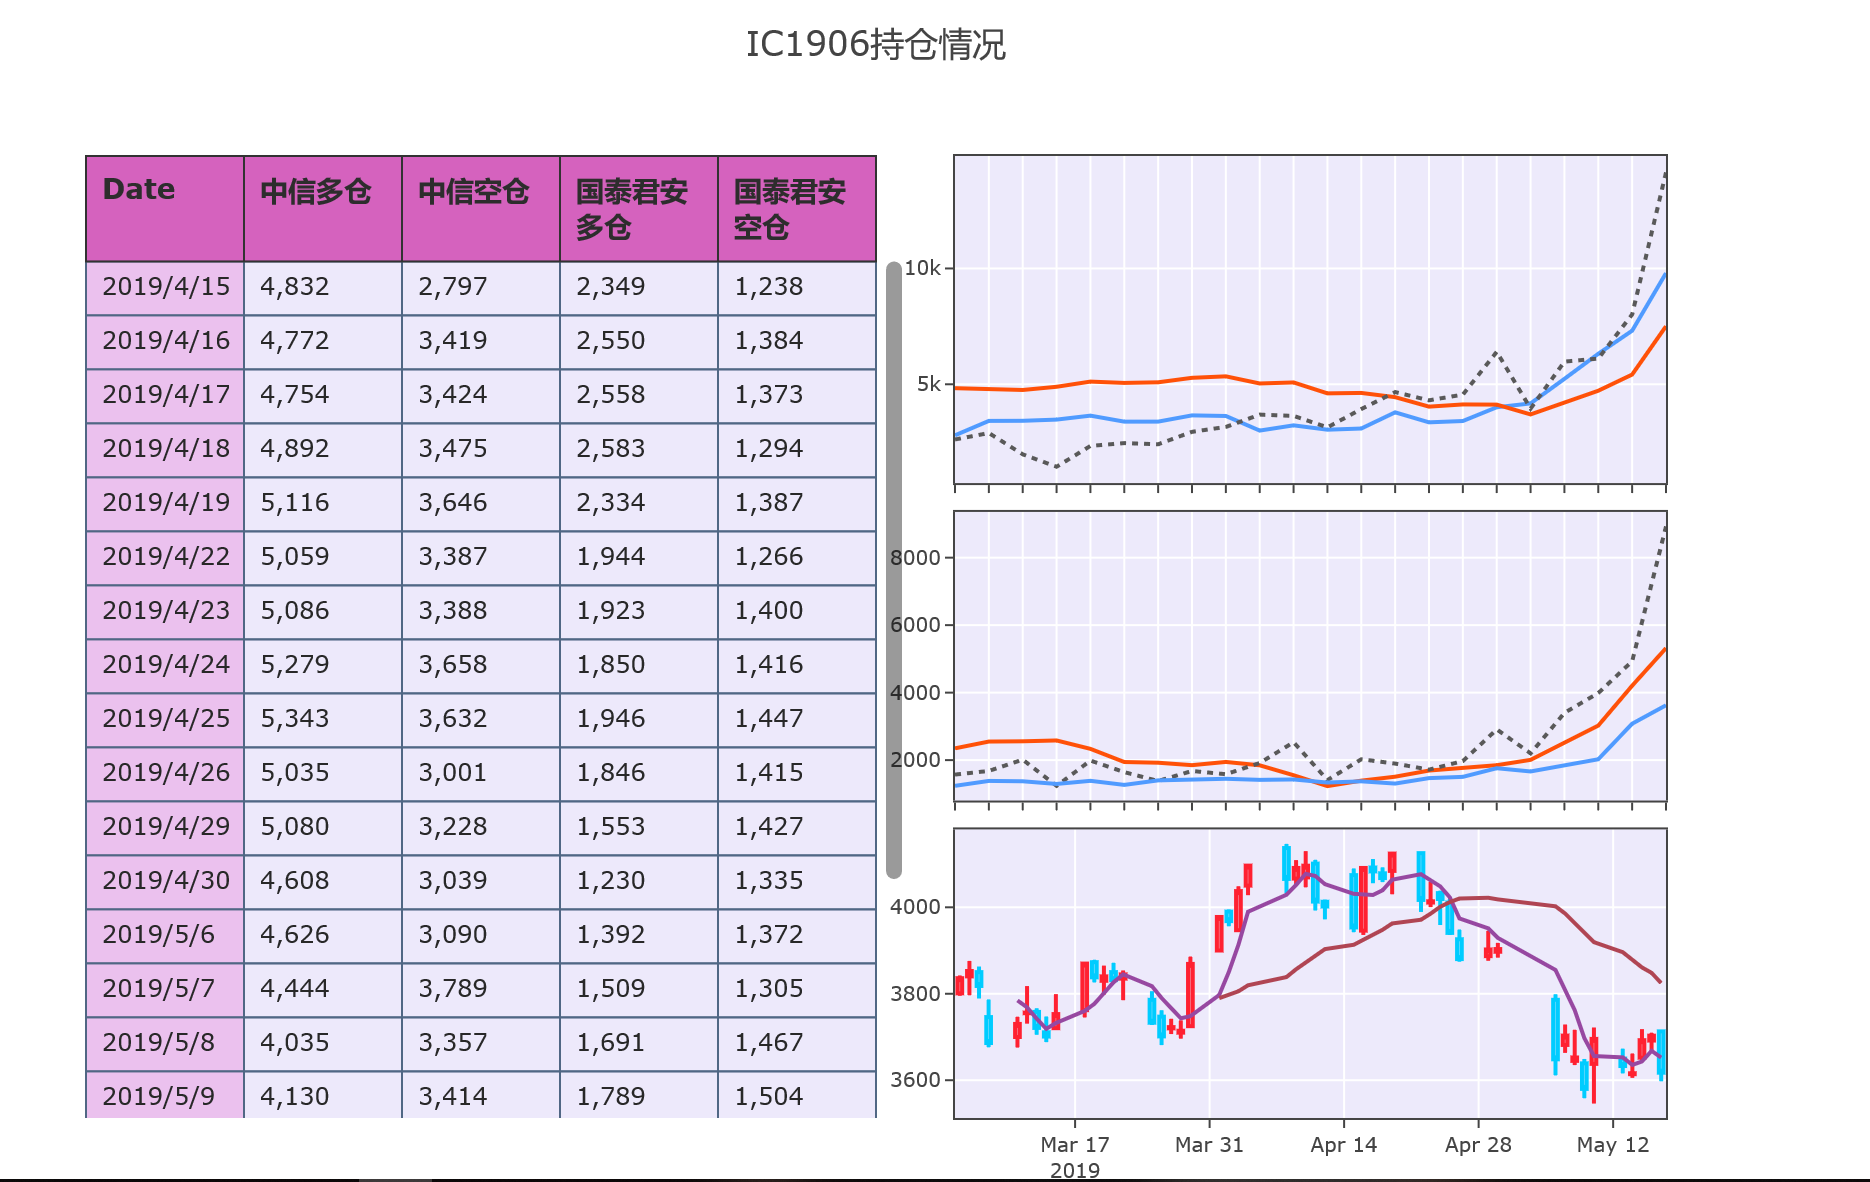
第一部分获取龙虎榜大券商的持仓数据,包括:
成交量,多仓,空仓;
第二部分plotly画图,取两个代表性的期货尚
中信和国泰君安(多空差较大)
plotly图像丰富,只能保存网页html格式或静态图片
#1获取数据
from jqdatasdk import *
import numpy as np
import pandas as pd
import matplotlib.pyplot as plt
import matplotlib.mlab as mlab
import matplotlib.ticker as ticker
plt.style.use("ggplot")
import talib
#解决中文显示问题
plt.rcParams['font.sans-serif']=['SimHei']
plt.rcParams['axes.unicode_minus'] = False
auth('','')
b1 = []
b2 = []
b3 = []
b4 = []
b5 = []
b11 = []
b12 = []
b13 = []
b14 = []
b15 = []
b21 = []
b22 = []
b23 = []
b24 = []
b25 = []
b31 = []
b32 = []
b33 = []
b34 = []
b35 = []
c1=[]
c2=[]
c3=[]
c4=[]
c5=[]
c11=[]
c12=[]
c13=[]
c14=[]
c15=[]
c21=[]
c22=[]
c23=[]
c24=[]
c25=[]
c31=[]
c32=[]
c33=[]
c34=[]
c35=[]

d1=[]
d2=[]
d3=[]
d4=[]
d5=[]
d21=[]
d22=[]
d23=[]
d24=[]
d25=[]
d31=[]
d32=[]
d33=[]
d34=[]
d35=[]
d11=[]
d12=[]
d13=[]
d14=[]
d15=[]


price=get_price('IF1906.CCFX',end_date='2019-05-17',count=22)

#501001-成交量排名, 501002-持买单量排名, 501003-持卖单量排名
date=['2019-04-15', '2019-04-16', '2019-04-17', '2019-04-18', '2019-04-19',
      '2019-04-22', '2019-04-23', '2019-04-24', '2019-04-25', '2019-04-26', '2019-04-29', '2019-04-30',
      '2019-05-06', '2019-05-07', '2019-05-08', '2019-05-09', '2019-05-10', '2019-05-13', '2019-05-14',
      '2019-05-15', '2019-05-16','2019-05-17','2019-05-20']
# 501002-持买单量排名
for k in date:
    q=query(    finance.FUT_MEMBER_POSITION_RANK.day,
                finance.FUT_MEMBER_POSITION_RANK.code,
                finance.FUT_MEMBER_POSITION_RANK.rank_type_ID,
                finance.FUT_MEMBER_POSITION_RANK.rank,
                finance.FUT_MEMBER_POSITION_RANK.member_name,
                finance.FUT_MEMBER_POSITION_RANK.indicator,
                finance.FUT_MEMBER_POSITION_RANK.indicator_increase,).filter(
                finance.FUT_MEMBER_POSITION_RANK.code=='IC1906.CCFX',
                finance.FUT_MEMBER_POSITION_RANK.rank_type_ID=='501002',
                finance.FUT_MEMBER_POSITION_RANK.day==k).order_by(
                finance.FUT_MEMBER_POSITION_RANK.member_name.desc())
    df=finance.run_query(q)
    for i in range(len(df)):
        a = "中信期货"
        if a in df.loc[i, 'member_name']:
            a1 = df.loc[i, 'member_name']
            a2 = df.loc[i, 'indicator']
            a3 = df.loc[i, 'indicator_increase']
            a4 = df.loc[i, 'code']
            a5 = df.loc[i,'day']
            b1.append(a1)
            b2.append(a2)
            b3.append(a3)
            b4.append(a4)
            b5.append(a5)
            print(b1)
    for ii in range(len(df)):
        a = "海通期货"
        if a in df.loc[ii, 'member_name']:
            a1 = df.loc[ii, 'member_name']
            a2 = df.loc[ii, 'indicator']
            a3 = df.loc[ii, 'indicator_increase']
            a4 = df.loc[ii, 'code']
            a5 = df.loc[ii,'day']
            b11.append(a1)
            b12.append(a2)
            b13.append(a3)
            b14.append(a4)
            b15.append(a5)

    for iii in range(len(df)):
        a = "国泰君安"
        if a in df.loc[iii, 'member_name']:
            a1 = df.loc[iii, 'member_name']
            a2 = df.loc[iii, 'indicator']
            a3 = df.loc[iii, 'indicator_increase']
            a4 = df.loc[iii, 'code']
            a5 = df.loc[iii,'day']
            b21.append(a1)
            b22.append(a2)
            b23.append(a3)
            b24.append(a4)
            b25.append(a5)
    for iiii in range(len(df)):
        a = "华泰期货"
        if a in df.loc[iiii, 'member_name']:
            a1 = df.loc[iiii, 'member_name']
            a2 = df.loc[iiii, 'indicator']
            a3 = df.loc[iiii, 'indicator_increase']
            a4 = df.loc[iiii, 'code']
            a5 = df.loc[iiii,'day']
            b31.append(a1)
            b32.append(a2)
            b33.append(a3)
            b34.append(a4)
            b35.append(a5)
f1 = pd.DataFrame(columns=['day', 'member_name', 'indicator','indicator_increase'])

f1['day']=b5
f1[ 'member_name'] = b1
f1['indicator'] = b2
f1['indicator_increase']=b3
f1 = f1.set_index(['day'])

f11 = pd.DataFrame(columns=['day', 'member_name', 'indicator','indicator_increase'])
f11['day']=b15
f11[ 'member_name'] = b11
f11['indicator'] = b12
f11['indicator_increase']=b13
f11 = f11.set_index(['day'])

f21 = pd.DataFrame(columns=['day', 'member_name', 'indicator','indicator_increase'])
f21['day']=b25
f21[ 'member_name'] = b21
f21['indicator'] = b22
f21['indicator_increase']=b23
f21 = f21.set_index(['day'])

f31 = pd.DataFrame(columns=['day', 'member_name', 'indicator','indicator_increase'])
f31['day']=b35
f31[ 'member_name'] = b31
f31['indicator'] = b32
f31['indicator_increase']=b33
f31 = f31.set_index(['day'])


#501003-持卖单量排名
for i in date:
    q=query(finance.FUT_MEMBER_POSITION_RANK.day,
                finance.FUT_MEMBER_POSITION_RANK.code,
                finance.FUT_MEMBER_POSITION_RANK.rank_type_ID,
                finance.FUT_MEMBER_POSITION_RANK.rank,
                finance.FUT_MEMBER_POSITION_RANK.member_name,
                finance.FUT_MEMBER_POSITION_RANK.indicator,
                finance.FUT_MEMBER_POSITION_RANK.indicator_increase,).filter(
                finance.FUT_MEMBER_POSITION_RANK.code=='IC1906.CCFX',
                finance.FUT_MEMBER_POSITION_RANK.rank_type_ID=='501003',
                finance.FUT_MEMBER_POSITION_RANK.day==i).order_by(
                finance.FUT_MEMBER_POSITION_RANK.member_name.desc())
    df=finance.run_query(q)
    for i in range(len(df)):
        a = "中信期货"
        if a in df.loc[i, 'member_name']:
            a1 = df.loc[i, 'member_name']
            a2 = df.loc[i, 'indicator']
            a3 = df.loc[i, 'indicator_increase']
            a4 = df.loc[i, 'code']
            a5 = df.loc[i,'day']
            c1.append(a1)
            c2.append(a2)
            c3.append(a3)
            c4.append(a4)
            c5.append(a5)
    for i in range(len(df)):
        a = "海通期货"
        if a in df.loc[i, 'member_name']:
            a1 = df.loc[i, 'member_name']
            a2 = df.loc[i, 'indicator']
            a3 = df.loc[i, 'indicator_increase']
            a4 = df.loc[i, 'code']
            a5 = df.loc[i, 'day']
            c11.append(a1)
            c12.append(a2)
            c13.append(a3)
            c14.append(a4)
            c15.append(a5)
    for i in range(len(df)):
            a = "国泰君安"
            if a in df.loc[i, 'member_name']:
                a1 = df.loc[i, 'member_name']
                a2 = df.loc[i, 'indicator']
                a3 = df.loc[i, 'indicator_increase']
                a4 = df.loc[i, 'code']
                a5 = df.loc[i, 'day']
                c21.append(a1)
                c22.append(a2)
                c23.append(a3)
                c24.append(a4)
                c25.append(a5)
    for i in range(len(df)):
            a = "华泰期货"
            if a in df.loc[i, 'member_name']:
                a1 = df.loc[i, 'member_name']
                a2 = df.loc[i, 'indicator']
                a3 = df.loc[i, 'indicator_increase']
                a4 = df.loc[i, 'code']
                a5 = df.loc[i, 'day']
                c31.append(a1)
                c32.append(a2)
                c33.append(a3)
                c34.append(a4)
                c35.append(a5)

f2 = pd.DataFrame(columns=['day', 'member_name', 'indicator','indicator_increase'])
f2['day']=c5
f2[ 'member_name'] = c1
f2['indicator'] = c2
f2['indicator_increase']=c3
f2 = f2.set_index(['day'])
f12 = pd.DataFrame(columns=['day', 'member_name', 'indicator','indicator_increase'])

f12['day']=c15
f12[ 'member_name'] = c11
f12['indicator'] = c12
f12['indicator_increase']=c13
f12 = f12.set_index(['day'])

f22 = pd.DataFrame(columns=['day', 'member_name', 'indicator','indicator_increase'])
f22['day']=c25
f22[ 'member_name'] = c21
f22['indicator'] = c22
f22['indicator_increase']=c23
f22 = f22.set_index(['day'])

f32 = pd.DataFrame(columns=['day', 'member_name', 'indicator','indicator_increase'])
f32['day']=c35
f32[ 'member_name'] = c31
f32['indicator'] =c32
f32['indicator_increase']=c33
f32 = f32.set_index(['day'])


#501001-成交量排名
for k in date:
    q=query(finance.FUT_MEMBER_POSITION_RANK.day,
                finance.FUT_MEMBER_POSITION_RANK.code,
                finance.FUT_MEMBER_POSITION_RANK.rank_type_ID,
                finance.FUT_MEMBER_POSITION_RANK.rank,
                finance.FUT_MEMBER_POSITION_RANK.member_name,
                finance.FUT_MEMBER_POSITION_RANK.indicator,
                finance.FUT_MEMBER_POSITION_RANK.indicator_increase,).filter(
                finance.FUT_MEMBER_POSITION_RANK.code=='IC1906.CCFX',
                finance.FUT_MEMBER_POSITION_RANK.rank_type_ID=='501001',
                finance.FUT_MEMBER_POSITION_RANK.day==k).order_by(
                finance.FUT_MEMBER_POSITION_RANK.member_name.desc())
    df=finance.run_query(q)
    for i in range(len(df)):
        a = "中信期货"
        if a in df.loc[i, 'member_name']:
            a1 = df.loc[i, 'member_name']
            a2 = df.loc[i, 'indicator']
            a3 = df.loc[i, 'indicator_increase']
            a4 = df.loc[i, 'code']
            a5 = df.loc[i,'day']
            d1.append(a1)
            d2.append(a2)
            d3.append(a3)
            d4.append(a4)
            d5.append(a5)
    for i in range(len(df)):
        a = "海通期货"
        if a in df.loc[i, 'member_name']:
            a1 = df.loc[i, 'member_name']
            a2 = df.loc[i, 'indicator']
            a3 = df.loc[i, 'indicator_increase']
            a4 = df.loc[i, 'code']
            a5 = df.loc[i, 'day']
            d11.append(a1)
            d12.append(a2)
            d13.append(a3)
            d14.append(a4)
            d15.append(a5)
    for i in range(len(df)):
        a = "国泰君安"
        if a in df.loc[i, 'member_name']:
            a1 = df.loc[i, 'member_name']
            a2 = df.loc[i, 'indicator']
            a3 = df.loc[i, 'indicator_increase']
            a4 = df.loc[i, 'code']
            a5 = df.loc[i, 'day']
            d21.append(a1)
            d22.append(a2)
            d23.append(a3)
            d24.append(a4)
            d25.append(a5)
    for i in range(len(df)):
        a = "华泰期货"
        if a in df.loc[i, 'member_name']:
            a1 = df.loc[i, 'member_name']
            a2 = df.loc[i, 'indicator']
            a3 = df.loc[i, 'indicator_increase']
            a4 = df.loc[i, 'code']
            a5 = df.loc[i, 'day']
            d31.append(a1)
            d32.append(a2)
            d33.append(a3)
            d34.append(a4)
            d35.append(a5)
f3 = pd.DataFrame(columns=['day', 'member_name', 'indicator','indicator_increase'])
f3['day']=d5
f3[ 'member_name'] = d1
f3['indicator'] = d2
f3['indicator_increase']=d3
f3 = f3.set_index(['day'])

f13 = pd.DataFrame(columns=['day', 'member_name', 'indicator','indicator_increase'])
f13['day']=d15
f13[ 'member_name'] = d11
f13['indicator'] = d12
f13['indicator_increase']=d13
f13 = f13.set_index(['day'])

f23 = pd.DataFrame(columns=['day', 'member_name', 'indicator','indicator_increase'])
f23['day']=d25
f23[ 'member_name'] = d21
f23['indicator'] = d22
f23['indicator_increase']=d23
f23 = f23.set_index(['day'])

f33 = pd.DataFrame(columns=['day', 'member_name', 'indicator','indicator_increase'])
f33['day']=d35
f33[ 'member_name'] = d31
f33['indicator'] = d32
f33['indicator_increase']=d33
f33 = f33.set_index(['day'])
print(f2)
print(f12)
#1
N = len(f1)
ind = np.arange(N) # the evenly spaced plot indices
def format_date(x, pos=None):
    #保证下标不越界,很重要,越界会导致最终plot坐标轴label无显示
    thisind = np.clip(int(x+0.5), 0, N-1)
    return f1.index[thisind].strftime('%Y-%m-%d')
N2 = len(f2)
ind2 = np.arange(N2) # the evenly spaced plot indices
N3 = len(f3)
ind3 = np.arange(N3) # the evenly spaced plot indices
#2
AN = len(f11)
Aind = np.arange(AN) # the evenly spaced plot indices
def Aformat_date(x, pos=None):
    #保证下标不越界,很重要,越界会导致最终plot坐标轴label无显示
    thisind = np.clip(int(x+0.5), 0, AN-1)
    return f11.index[thisind].strftime('%Y-%m-%d')
AN2 = len(f12)
Aind2 = np.arange(AN2) # the evenly spaced plot indices
AN3 = len(f13)
Aind3 = np.arange(AN3) # the evenly spaced plot indices
#3
BN = len(f21)
Bind = np.arange(BN) # the evenly spaced plot indices
def Bformat_date(x, pos=None):
    #保证下标不越界,很重要,越界会导致最终plot坐标轴label无显示
    thisind = np.clip(int(x+0.5), 0, BN-1)
    return f21.index[thisind].strftime('%Y-%m-%d')
BN2 = len(f22)
Bind2 = np.arange(BN2) # the evenly spaced plot indices
BN3 = len(f23)
Bind3 = np.arange(BN3) # the evenly spaced plot indices
#4

CN = len(f31)
Cind = np.arange(CN) # the evenly spaced plot indices
def Cformat_date(x, pos=None):
    #保证下标不越界,很重要,越界会导致最终plot坐标轴label无显示
    thisind = np.clip(int(x+0.5), 0, CN-1)
    return f31.index[thisind].strftime('%Y-%m-%d')
CN2 = len(f32)
Cind2 = np.arange(CN2) # the evenly spaced plot indices
CN3 = len(f33)
Cind3 = np.arange(CN3) # the evenly spaced plot indices

fig = plt.figure(figsize=(15,10))

#1
ax1 = fig.add_subplot(2,2,1)
ax1.plot(ind,f1.indicator, color="red",label="持买单量",  marker='.',alpha=0.8, linewidth=0.6)
ax1.set_title("IC1905 中信期货持仓情况")
for j in range(1, len(f1)):
    plt.text(ind[j],f1.indicator[j], str(f1.indicator[j]), fontsize=10, va='bottom', color="red", wrap=True)
ax1.plot(ind2,f2.indicator, color="green",label="持卖单量", marker='.', alpha=0.8, linewidth=0.6)
for j in range(1, len(f2)):
    plt.text(ind2[j],f2.indicator[j], str(f2.indicator[j]), fontsize=10, ha='right', color="green", wrap=True)
ax1.plot(ind3,f3.indicator, color="blue",label="当日成交量", marker='.', alpha=0.8, linewidth=0.6)
for j in range(1, len(f3)):
    plt.text(ind3[j],f3.indicator[j], str(f3.indicator[j]), fontsize=10, ha='left', color="blue", wrap=True)

#2
bx1 = fig.add_subplot(2,2,2)
bx1.plot(Aind,f11.indicator, color="red",label="持买单量", marker='.',alpha=0.8, linewidth=0.6)
bx1.set_title("IC1905 海通期货持仓情况")
for j in range(1, len(f11)):
    plt.text(Aind[j],f11.indicator[j], str(f11.indicator[j]), fontsize=10, va='bottom', color="red", wrap=True)
bx1.plot(Aind2,f12.indicator, color="green",label="持卖单量", marker='.',alpha=0.8, linewidth=0.6)
for j in range(1, len(f12)):
    plt.text(Aind2[j],f12.indicator[j], str(f12.indicator[j]), fontsize=10, ha='right', color="green", wrap=True)
bx1.plot(Aind3,f13.indicator, color="blue",label="当日成交量",marker='.', alpha=0.8, linewidth=0.6)
for j in range(1, len(f13)):
    plt.text(Aind3[j],f13.indicator[j], str(f13.indicator[j]), fontsize=10, ha='left', color="blue", wrap=True)

#3
cx1 = fig.add_subplot(2,2,3)
cx1.plot(Bind,f21.indicator, color="red",label="持买单量", marker='.',alpha=0.8, linewidth=0.6)
cx1.set_title("IC1905 国泰君安持仓情况")
for j in range(1, len(f21)):
    plt.text(Bind[j],f21.indicator[j], str(f21.indicator[j]), fontsize=10, va='bottom', color="red", wrap=True)
cx1.plot(Bind2,f22.indicator, color="green",label="持卖单量",marker='.', alpha=0.8, linewidth=0.6)
for j in range(1, len(f22)):
    plt.text(Bind2[j],f22.indicator[j], str(f22.indicator[j]), fontsize=10, ha='right', color="green", wrap=True)
cx1.plot(Bind3,f23.indicator, color="blue",label="当日成交量",marker='.', alpha=0.8, linewidth=0.6)
for j in range(1, len(f23)):
    plt.text(Bind3[j],f23.indicator[j], str(f23.indicator[j]), fontsize=10, ha='left', color="blue", wrap=True)

#4
dx1 = fig.add_subplot(2,2,4)
dx1.plot(Cind,f31.indicator, color="red",label="持买单量", marker='.',alpha=0.8, linewidth=0.6)
dx1.set_title("IC1905 华泰期货持仓情况")
for j in range(1, len(f31)):
    plt.text(Cind[j],f31.indicator[j], str(f31.indicator[j]), fontsize=10, va='bottom', color="red", wrap=True)
dx1.plot(Cind2,f32.indicator, color="green",label="持卖单量", marker='.',alpha=0.8, linewidth=0.6)
for j in range(1, len(f32)):
    plt.text(Cind2[j],f32.indicator[j], str(f32.indicator[j]), fontsize=10, ha='right', color="green", wrap=True)
dx1.plot(Cind3,f33.indicator, color="blue",label="当日成交量",marker='.', alpha=0.8, linewidth=0.6)
for j in range(1, len(f33)):
    plt.text(Cind3[j],f33.indicator[j], str(f33.indicator[j]), fontsize=10, ha='left', color="blue", wrap=True)
ax1.xaxis.set_major_formatter(ticker.FuncFormatter(format_date))
bx1.xaxis.set_major_formatter(ticker.FuncFormatter(Aformat_date))
cx1.xaxis.set_major_formatter(ticker.FuncFormatter(Bformat_date))
dx1.xaxis.set_major_formatter(ticker.FuncFormatter(Cformat_date))
fig.autofmt_xdate()


handles, labels = ax1.get_legend_handles_labels()
# reverse the order
ax1.legend(handles[::-1], labels[::-1])

handles, labels = bx1.get_legend_handles_labels()
# reverse the order
bx1.legend(handles[::-1], labels[::-1])

handles, labels = cx1.get_legend_handles_labels()
# reverse the order
cx1.legend(handles[::-1], labels[::-1])

handles, labels = dx1.get_legend_handles_labels()
# reverse the order
dx1.legend(handles[::-1], labels[::-1])
plt.savefig('IC1905.png')
plt.show()

r=pd.concat([price.close,
             f1.indicator,
             f2.indicator,
             f3.indicator,
             f11.indicator,
             f12.indicator,
             f13.indicator,
             f21.indicator,
             f22.indicator,
             f23.indicator,
             f31.indicator,
             f32.indicator,
             f33.indicator],axis=1)
r.columns = ['pct', 'citic_long','citic_short','citic_change',
                    'ht_long','ht_short','ht_change',
                    'gtja_long','gtja_short','gtja_change',
                     'ht_long','ht_short','ht_change']
r.to_csv('future_re.csv')
#2画图
import plotly.plotly as py
import plotly.graph_objs as go
import plotly
import plotly.graph_objs as go
import numpy as np
import pandas as pd
from jqdatasdk import *
auth('','')
import pandas as pd
import talib

df = pd.read_csv('future_re.csv')
future_jq= get_price('IF1906.CCFX', end_date='2019-05-17',count=50)

# remove min:sec:millisec from dates
'''for i, row in enumerate(df['Date']):
    p = re.compile(' 00:00:00')
    datetime = p.split(df['Date'][i])[0]
    df.iloc[i, 1] = datetime'''


table_trace1 = go.Table(
    domain=dict(x=[0, 0.5],
                y=[0, 1]),
    columnwidth = [20] + [20, 20, 20,20],
    columnorder=[0, 1, 2, 3, 4,5],
    header = dict(height = 50,
                  values = [['<b>Date</b>'],['<b>中信多仓</b>'],
                            ['<b>中信空仓</b>'], ['<b>国泰君安<br>多仓</b>'],['<b>国泰君安<br>空仓</b>']],
                  line = dict(color='rgb(50, 50, 50)'),
                  align = ['left'] * 5,
                  font = dict(color=['rgb(45, 45, 45)'] * 6, size=14),
                  fill = dict(color='#d562be')),

    cells = dict(values = [df[k].tolist() for k in
                          ['date', 'citic_long', 'citic_short', 'gtja_long','gtja_short']],
                 line = dict(color='#506784'),
                 align = ['left'] * 6,
                 font = dict(color=['rgb(40, 40, 40)'] * 6, size=12),
                 format = [None] + [", .2f"] *4 ,
                 prefix = [None] * 5 ,
                 suffix=[None] * 5,
                 height = 27,
                 fill = dict(color=['rgb(235, 193, 238)', 'rgba(228, 222, 249, 0.65)']))
)


trace1 =go.Scatter(
    x=df['date'],
    y=df['citic_short'],
    xaxis='x1',
    yaxis='y1',
    mode='lines',
    line=dict(width=2, color='#509BFF'),
    name='中信空仓'
)
trace11=go.Scatter(
    x=df['date'],
    y=df['citic_long'],
    xaxis='x1',
    yaxis='y1',
    mode='lines',
    line=dict(width=2, color='#FF5108'),
    name='中信多仓'
)
trace12=go.Scatter(
    x=df['date'],
    y=df['citic_change'],
    xaxis='x1',
    yaxis='y1',
    mode='lines',
    line=dict(width=2, dash = 'dot',color='#595959'),
    name='中信换手'

)

trace2=go.Scatter(
    x=df['date'],
    y=df['gtja_long'],
    xaxis='x2',
    yaxis='y2',
    mode='lines',
    line=dict(width=2, color='#FF5108'),
    name='国泰君安空仓'
)
trace21 =go.Scatter(
    x=df['date'],
    y=df['gtja_change'],
    xaxis='x2',
    yaxis='y2',
    mode='lines',
    line=dict(width=2,dash = 'dot', color='#595959'),
    name='国泰君安换手'
)
trace22 =go.Scatter(
    x=df['date'],
    y=df['gtja_short'],
    xaxis='x2',
    yaxis='y2',
    mode='lines',
    line=dict(width=2, color='#509BFF'),
    name='国泰君安多仓'
)


trace3 = go.Candlestick(x=future_jq.index,
                        xaxis='x3',
                        yaxis='y3',
                open=future_jq.open,
                high=future_jq.high,
                low=future_jq.low,
                close=future_jq.close,
                name = "IC1906",
                increasing=dict(line=dict(color='#FF2131')),
                decreasing=dict(line=dict(color='#00CCFF'))
)
trace31 =go.Scatter(
    x=future_jq.index,
    y=talib.MA(future_jq.close,5),
    xaxis='x3',
    yaxis='y3',
    mode='lines',
    line=dict(width=2, color='#9748a1'),
    name='MA5'
)
trace32 =go.Scatter(
    x=future_jq.index,
    y=talib.MA(future_jq.close,20),
    xaxis='x3',
    yaxis='y3',
    mode='lines',
    line=dict(width=2, color='#b04553'),
    name='MA20'
)
axis=dict(
    showline=True,
    zeroline=False,
    showgrid=True,
    mirror=True,
    ticklen=4,
    gridcolor='#ffffff',
    tickfont=dict(size=10)
)


layout1 = dict(
    width=950,
    height=800,
    autosize=False,
    title='IC1906持仓情况',
    margin = dict(t=100),
    showlegend=False,
    xaxis1=dict(axis, **dict(domain=[0.55, 1], anchor='y1', showticklabels=False)),
    xaxis2=dict(axis, **dict(domain=[0.55, 1], anchor='y2', showticklabels=False)),
    xaxis3=dict(axis, **dict(domain=[0.55, 1], anchor='y3')),
    yaxis1=dict(axis, **dict(domain=[0.66, 1.0], anchor='x1')),
    yaxis2=dict(axis, **dict(domain=[0.3 + 0.03, 0.63], anchor='x2')),
    yaxis3=dict(axis, **dict(domain=[0.0, 0.3], anchor='x3')),
    plot_bgcolor='rgba(228, 222, 249, 0.65)'
)
#tickprefix='$',

fig1 = dict(data=[table_trace1, trace1,trace11,trace12,trace2,trace21,trace22, trace3,trace31,trace32 ], layout=layout1)
plotly.offline.plot(fig1, filename='table.html')